Fig. 11.
Download original image
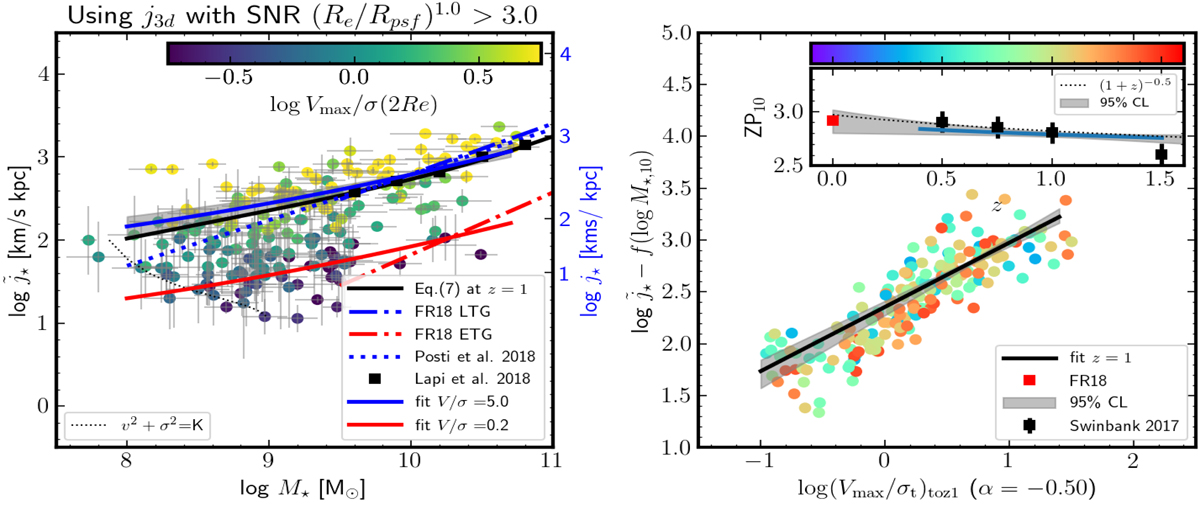
Specific angular momentum for the 182 galaxies in the MUSE UDF mosaic fields with a max S/N ≳ 3. Left: total specific angular momentum ![]() (SFR weighted) as a function of stellar mass M⋆. The points are color-coded as a function of V/σt. The right-axis shows the corresponding j⋆ according to the 0.25dex offset found in Fig. 7. The blue (red) dashed line show the
(SFR weighted) as a function of stellar mass M⋆. The points are color-coded as a function of V/σt. The right-axis shows the corresponding j⋆ according to the 0.25dex offset found in Fig. 7. The blue (red) dashed line show the ![]() sequence for late (early) type galaxies at z = 0 from Fall & Romanowsky (2018, FR18). The dotted line (solid squares) show the z = 0 sAM j⋆ − M⋆ sequence from Posti et al. (2018a) (Lapi et al. 2018), respectively. The dotted line show the
sequence for late (early) type galaxies at z = 0 from Fall & Romanowsky (2018, FR18). The dotted line (solid squares) show the z = 0 sAM j⋆ − M⋆ sequence from Posti et al. (2018a) (Lapi et al. 2018), respectively. The dotted line show the ![]() sequence for z = 0 disk galaxies of Posti et al. (2018a). The solid black line shows the expected j⋆ − M⋆ relation from Eq. (8). The solid blue and red lines show the fitted fiducial model from Eq. (9) and the gray band represents the 95% confidence interval. Right: normalized AM sequence
sequence for z = 0 disk galaxies of Posti et al. (2018a). The solid black line shows the expected j⋆ − M⋆ relation from Eq. (8). The solid blue and red lines show the fitted fiducial model from Eq. (9) and the gray band represents the 95% confidence interval. Right: normalized AM sequence ![]() as a function of (V/σt)toz1 (normalized to z = 1 see text), i.e. after taking into account for the redshift evolution of σt(z), where the points are color-coded with redshift. In the inset, we show the redshift evolution of the sAM relation at M⋆ = 1010 M⊙ (solid line) at fixed (V/σt)toz1 (=5) along with the 95% predictive interval (gray band), with the z = 0 ZP from Fall & Romanowsky (2018) (red square), the Swinbank et al. (2017) binned data (see text), and the expected (1 + z)−0.5 evolution (dotted line) from Eq. (8).
as a function of (V/σt)toz1 (normalized to z = 1 see text), i.e. after taking into account for the redshift evolution of σt(z), where the points are color-coded with redshift. In the inset, we show the redshift evolution of the sAM relation at M⋆ = 1010 M⊙ (solid line) at fixed (V/σt)toz1 (=5) along with the 95% predictive interval (gray band), with the z = 0 ZP from Fall & Romanowsky (2018) (red square), the Swinbank et al. (2017) binned data (see text), and the expected (1 + z)−0.5 evolution (dotted line) from Eq. (8).
Current usage metrics show cumulative count of Article Views (full-text article views including HTML views, PDF and ePub downloads, according to the available data) and Abstracts Views on Vision4Press platform.
Data correspond to usage on the plateform after 2015. The current usage metrics is available 48-96 hours after online publication and is updated daily on week days.
Initial download of the metrics may take a while.