Fig. 10.
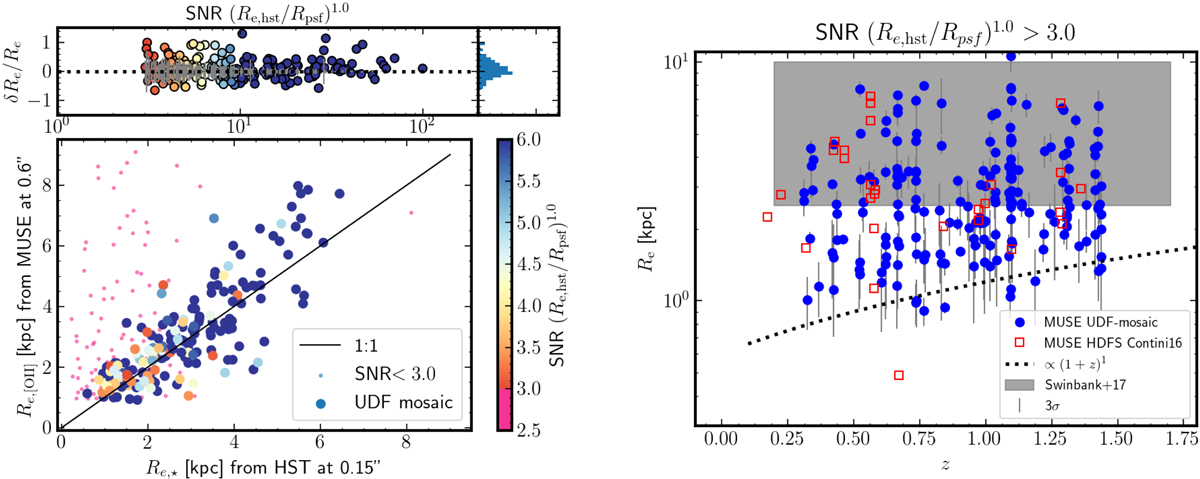
Download original image
Left: comparison between [O II]-based sizes Re from MUSE (at FWHM ≈ 0.7″ resolution) versus H-band continuum Re, ⋆ from HST/F160W at ≈0.15″ resolution, for the full sample of 494 SFGs, where the points are color-coded according to Eq. (6). The top panel shows the relative error δRe/Re as a function of the effective S/N (see text) and the side histogram shows its distribution. The gray errorbars represent the 3σt statistical uncertainties. This shows that our MUSE-[O II] sizes are of sufficient accuracy down to ≈1 kpc, provided that the effective S/N is ⪆3. Right: sizes Re (from HST/F160W) as a function of redshift for 182 galaxies in the MUSE UDF-mosaic field whose effective S/N is sufficient. The gray region represents the region probed by Swinbank et al. (2017). The dashed line represents ∝(1 + z)1. The vertical error bars are 3σ.
Current usage metrics show cumulative count of Article Views (full-text article views including HTML views, PDF and ePub downloads, according to the available data) and Abstracts Views on Vision4Press platform.
Data correspond to usage on the plateform after 2015. The current usage metrics is available 48-96 hours after online publication and is updated daily on week days.
Initial download of the metrics may take a while.