Fig. 8
Download original image
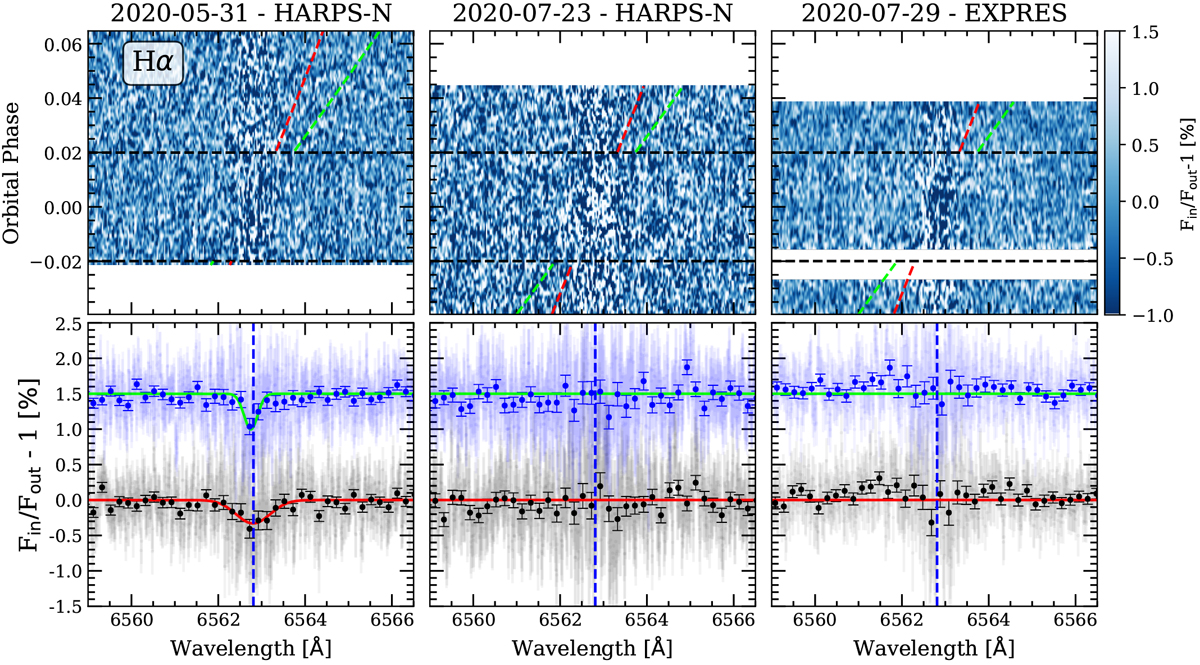
Top panels: residual map around the Hα line for the first night (left), second night (middle), and the EXPRES night (right). The horizontal black lines indicate the beginning and end of the transit. The red-dashed line shows the expected radial-velocity movement of the planet absorption (Kp = 188.15 km s−1), plotted only in the out-of-transit regions for a better visualisation of the in-transit residuals. The green-dashed lines corresponds to Kp = 340 km s−1. Bottom panels: transmission spectrum of TOI-1431b around the Hα line for Night 1 (left) and Night 2 (middle) obtained with the HARPS-N, and the night of 2020-07-29 (right) observed with EXPRES. In light gray we show the original data, and the black dots are the data binned at intervals of 0.2 Å. In this case, the transmission spectrum is obtained assuming Kp = 188.15 km s−1. In blue and with an offset of 1.5% for better visualisation, the transmission spectrum obtained at Kp = 340 km s−1 is shown with the best fit Gaussian profile in green-dashed lines. The red line is the best fit Gaussian profile. The blue vertical line shows the laboratory position (at 6562.81 Å) of the Hα line.
Current usage metrics show cumulative count of Article Views (full-text article views including HTML views, PDF and ePub downloads, according to the available data) and Abstracts Views on Vision4Press platform.
Data correspond to usage on the plateform after 2015. The current usage metrics is available 48-96 hours after online publication and is updated daily on week days.
Initial download of the metrics may take a while.