Fig. 5
Download original image
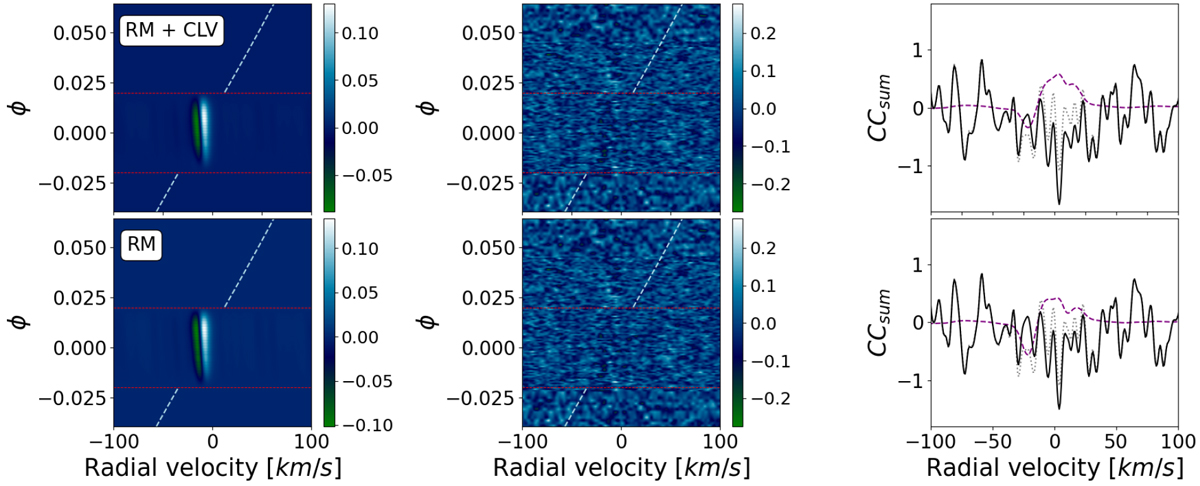
Left panels: RM plus CLV model (top) and the RM alone model (bottom) for Fe I. Middle panels: cross-correlation residual maps of Fe I for the combination of two HARPS-N nights after removing the modelled effects in the left panels. The red horizontal lines represent the beginning and end of the transit. The light-blue tilted dashed line shows the position of the expected signal of the planet. Right panels: cross-correlation sum plots at the expected Kp value, before (gray dotted line) and after (black line) removing the effects. In purple we show the calculated models for each effect.
Current usage metrics show cumulative count of Article Views (full-text article views including HTML views, PDF and ePub downloads, according to the available data) and Abstracts Views on Vision4Press platform.
Data correspond to usage on the plateform after 2015. The current usage metrics is available 48-96 hours after online publication and is updated daily on week days.
Initial download of the metrics may take a while.