Fig. A.4
Download original image
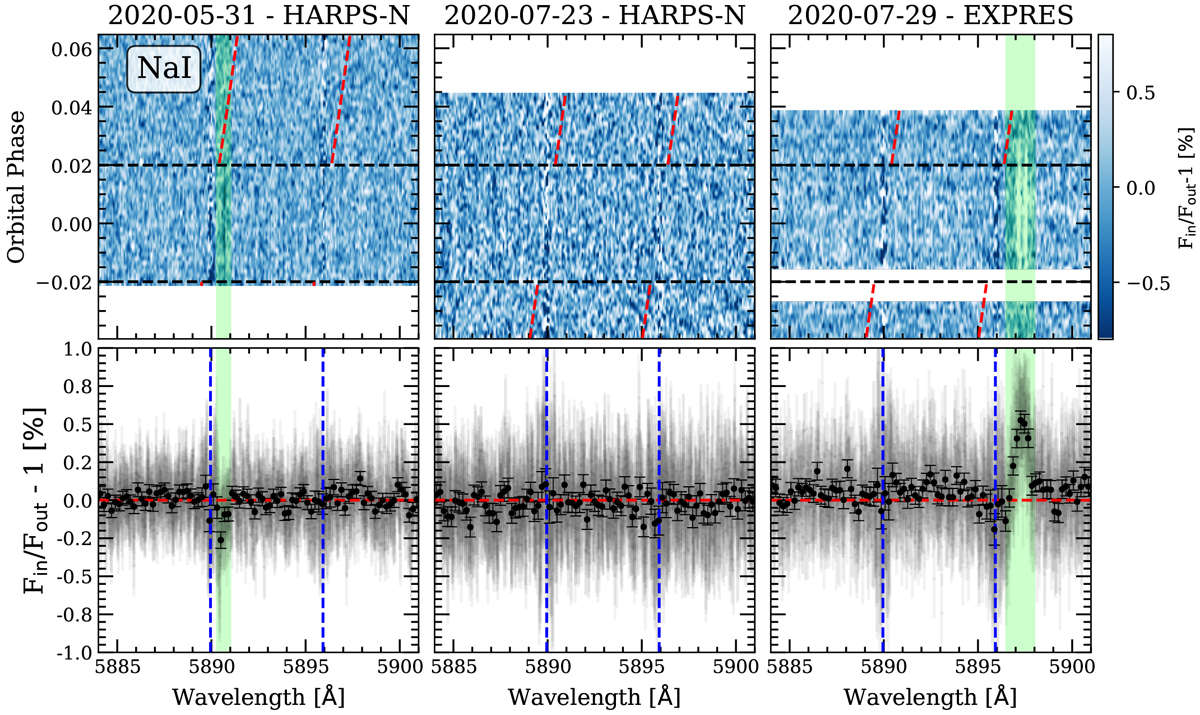
Same as Figure 8 but for the Na I doublet. In light green we mark the regions affected by telluric residuals. The residual observed in the left panel (2020-05-31) corresponds to a telluric Na I emission line which has not been completely corrected in the sky subtraction, probably due to the different efficiency of the two fibers. The residual observed in the right panel (2020-07-29) is produced by two H2 O absorption lines that are not detected by SELENITE in the telluric correction.
Current usage metrics show cumulative count of Article Views (full-text article views including HTML views, PDF and ePub downloads, according to the available data) and Abstracts Views on Vision4Press platform.
Data correspond to usage on the plateform after 2015. The current usage metrics is available 48-96 hours after online publication and is updated daily on week days.
Initial download of the metrics may take a while.