Fig. 3.
Download original image
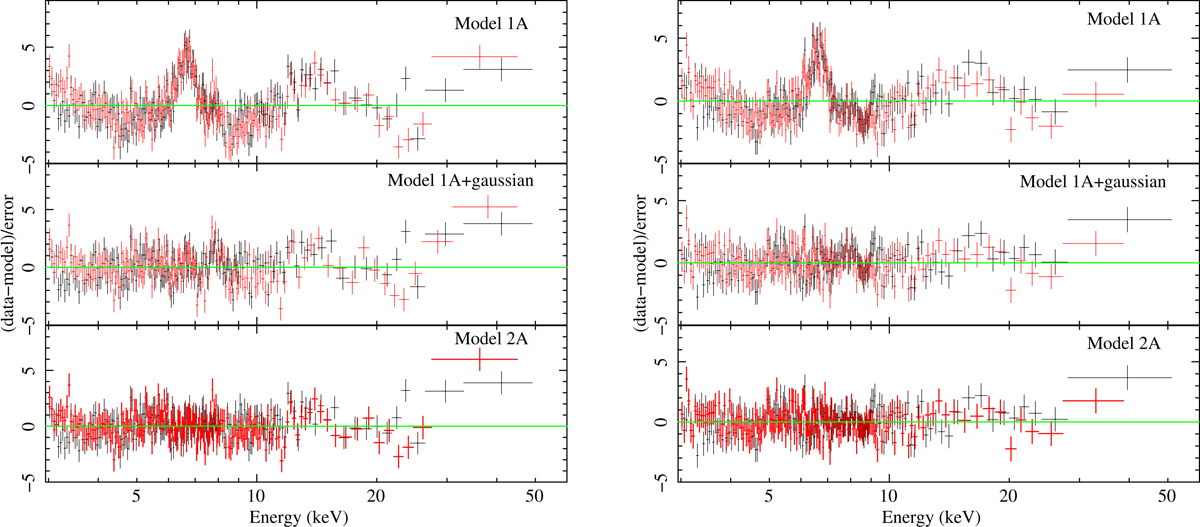
Comparison between residuals obtained adopting Model 1A (left, top panel), Model 1A plus a Gaussian component (middle panel), and Model 2A (bottom panel) for NB. On the right, we show the same comparison for FB. The FPMA and FPMB data are shown in black and red, respectively. The residuals are graphically re-binned in order to have at least 100σ per bin.
Current usage metrics show cumulative count of Article Views (full-text article views including HTML views, PDF and ePub downloads, according to the available data) and Abstracts Views on Vision4Press platform.
Data correspond to usage on the plateform after 2015. The current usage metrics is available 48-96 hours after online publication and is updated daily on week days.
Initial download of the metrics may take a while.