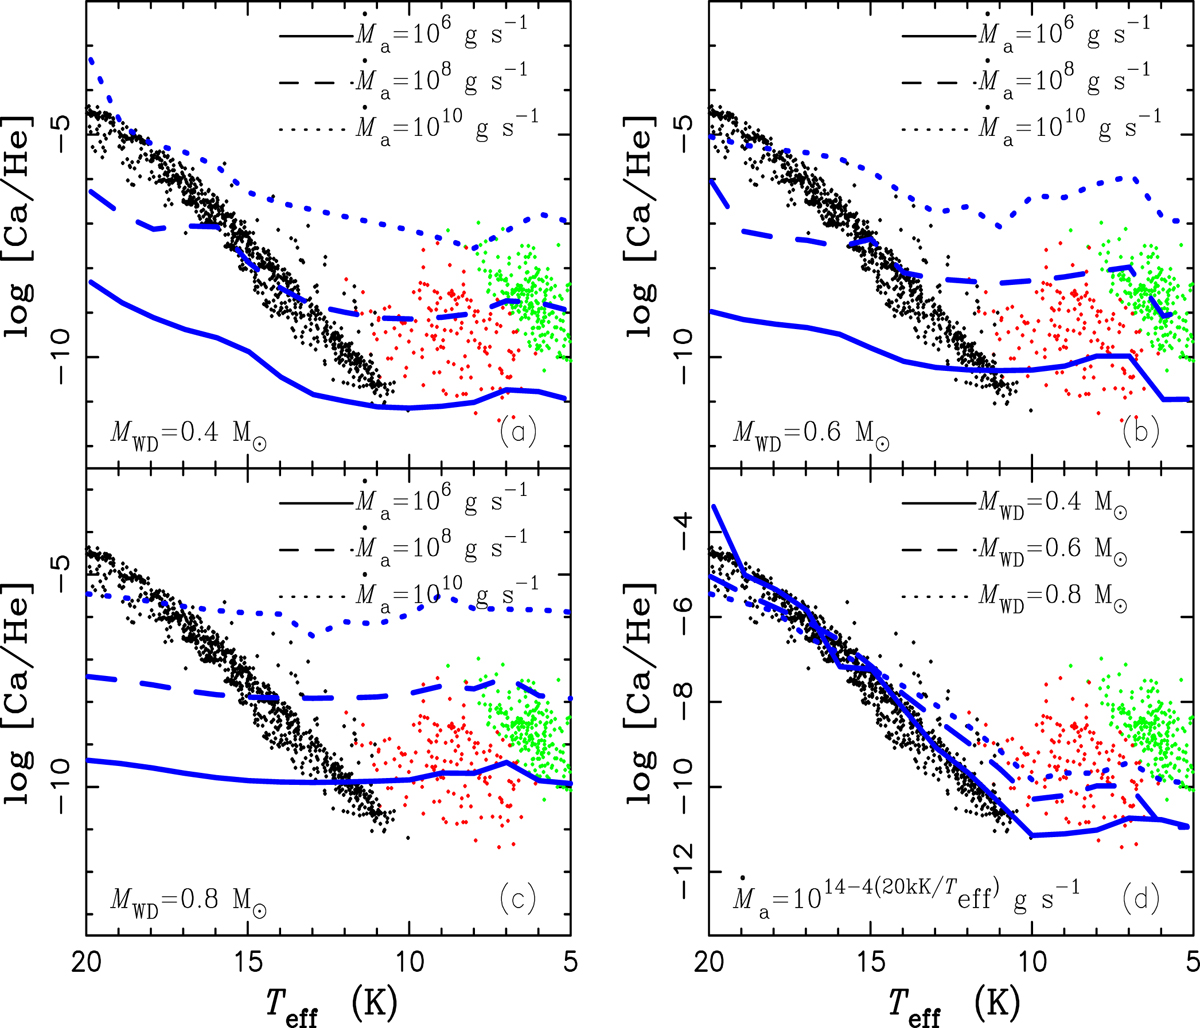
Fig. 12.
Download original image
Effective temperature vs. log [Ca/He] for DB WDs. Panels (a), (b), and (c) represent models with different mass DB WDs and a constant accretion rate (106, 108 and 1010 g s−1), respectively. Panels (d) is for the mass-accretion rate given by Eq. (5). Black, red and green dots represent observations from Koester & Kepler (2015), Dufour et al. (2007) and Hollands et al. (2017), respectively.
Current usage metrics show cumulative count of Article Views (full-text article views including HTML views, PDF and ePub downloads, according to the available data) and Abstracts Views on Vision4Press platform.
Data correspond to usage on the plateform after 2015. The current usage metrics is available 48-96 hours after online publication and is updated daily on week days.
Initial download of the metrics may take a while.