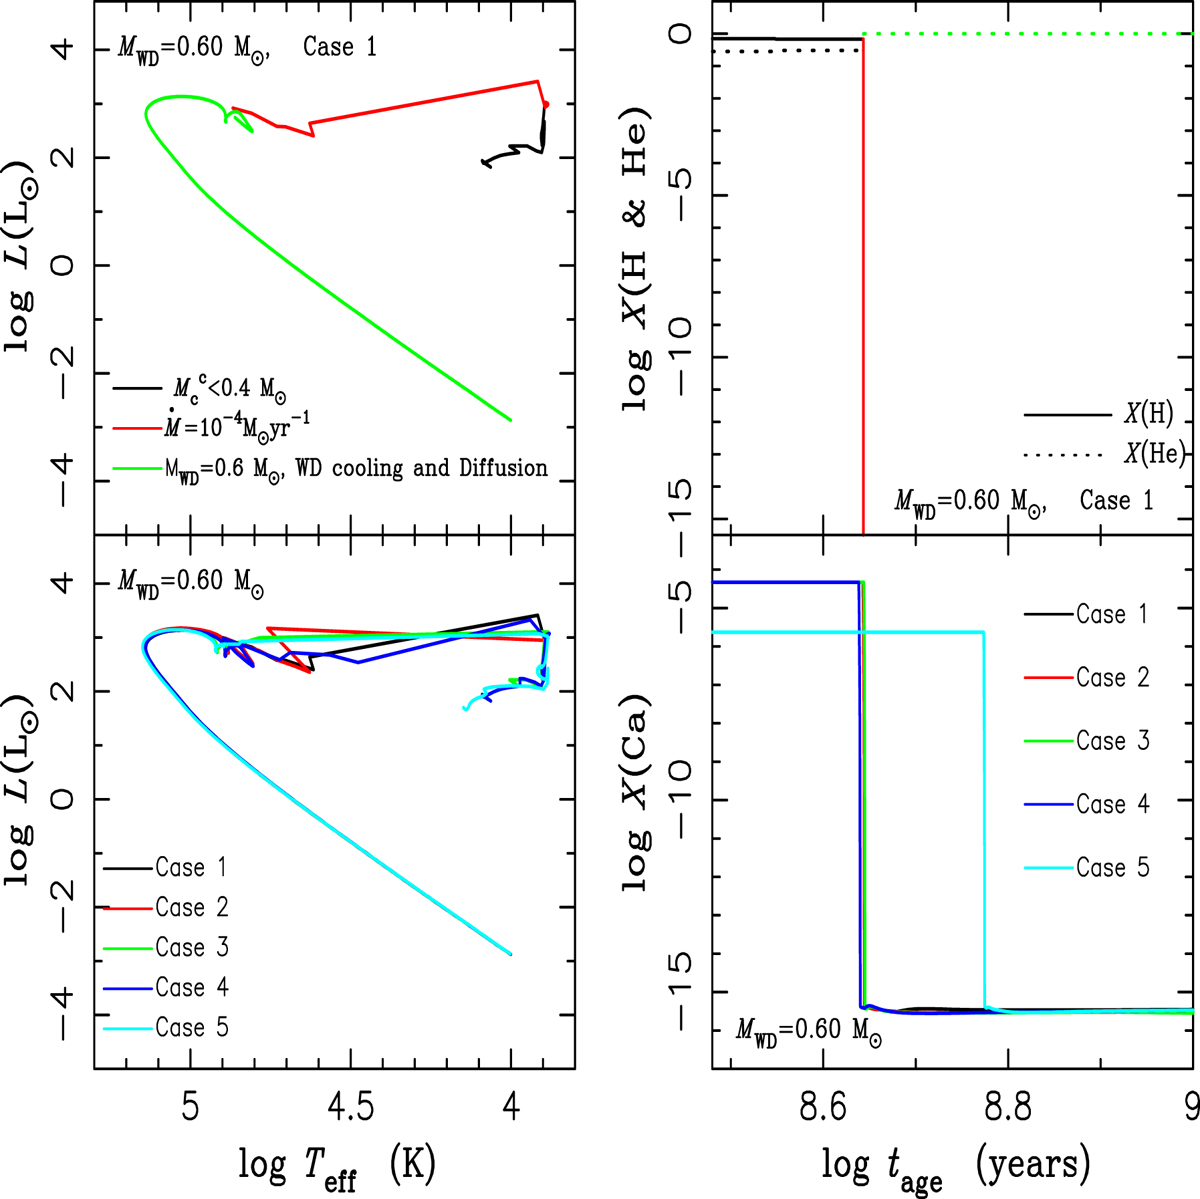
Fig. 1.
Download original image
DB WD with a mass of 0.6 M⊙ produced by the main sequence star with an initial mass of 3.5 M⊙. The top left panel gives the evolution in the HR diagram for the star in case 1 (αMLT = 1.8, αth = 1 and Z = 0.02), in which the lines with different colors represent different evolutionary phases. The bottom left panel shows the evolutions in the HR diagram for stars with different input parameters which are given by different colors. The top right panel is similar to the top left panel, but for the evolution of H and He abundances on the stellar surface. The bottom right panel is similar to the bottom left panel, but for the evolution of the Ca abundance on stellar surfaces. Further details can be found in the text.
Current usage metrics show cumulative count of Article Views (full-text article views including HTML views, PDF and ePub downloads, according to the available data) and Abstracts Views on Vision4Press platform.
Data correspond to usage on the plateform after 2015. The current usage metrics is available 48-96 hours after online publication and is updated daily on week days.
Initial download of the metrics may take a while.