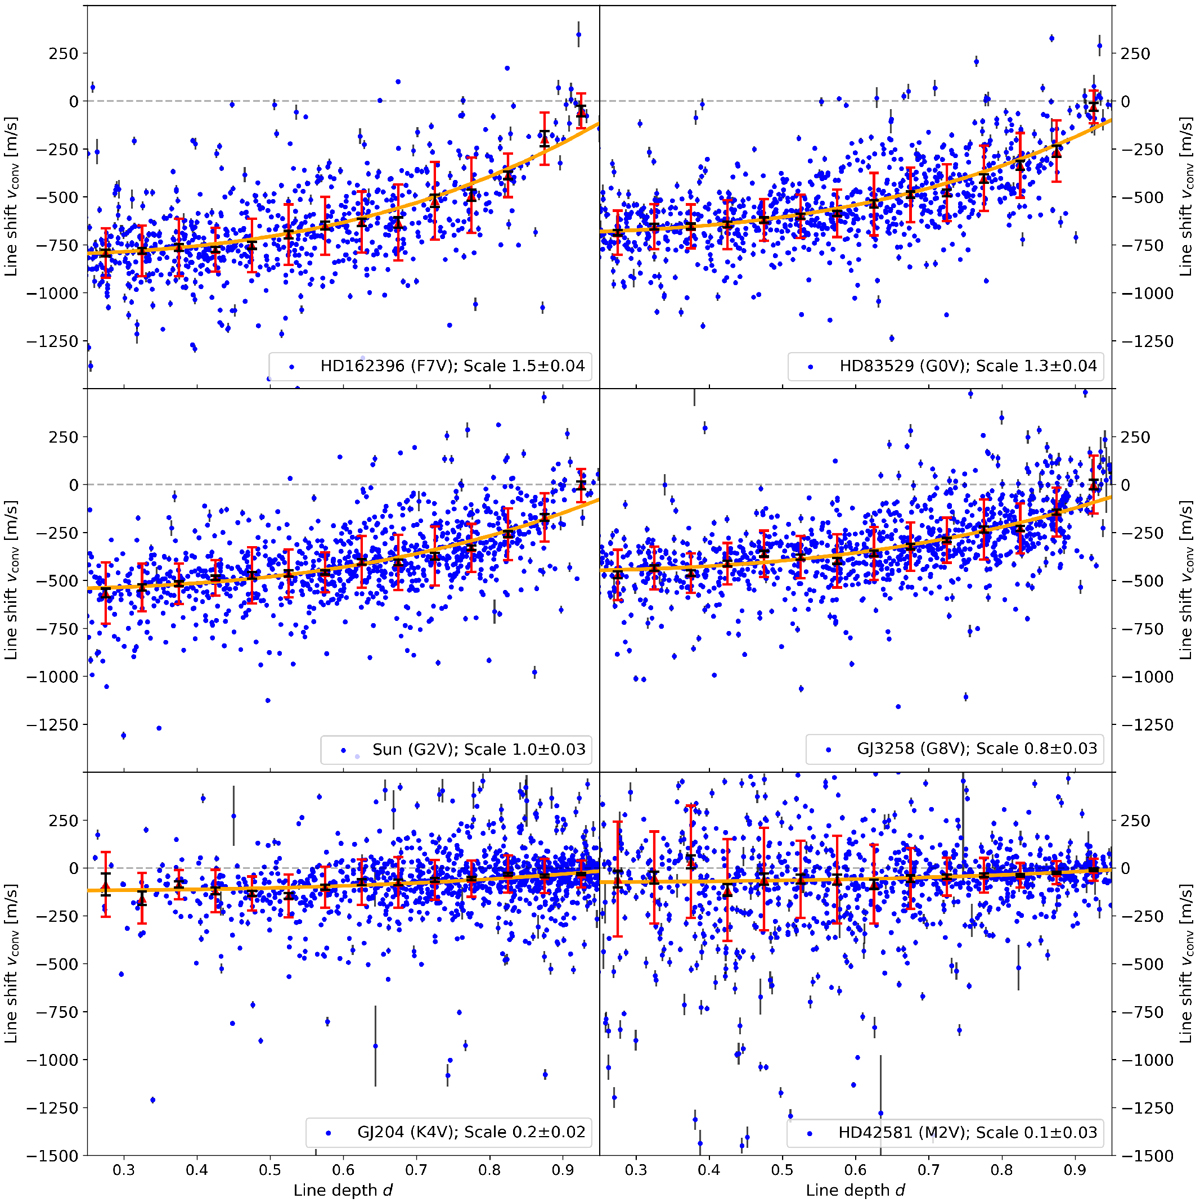
Fig. 5
Download original image
Example third-signature plots derived from HARPS data and solar FTS, convolved to R = 110 000, for spectral types ranging from F7V (top left) to M2V (bottom left), chosen to sample the scale factor range. Shown are shifts vconv for individual lines (blue circles) and results binned by line depth (red triangles with error bars for MAD, black for the error of the median). The best-fit, scaled, solar third signature is shown (orange curve, fitted through the red markers).
Current usage metrics show cumulative count of Article Views (full-text article views including HTML views, PDF and ePub downloads, according to the available data) and Abstracts Views on Vision4Press platform.
Data correspond to usage on the plateform after 2015. The current usage metrics is available 48-96 hours after online publication and is updated daily on week days.
Initial download of the metrics may take a while.