Fig. 4
Download original image
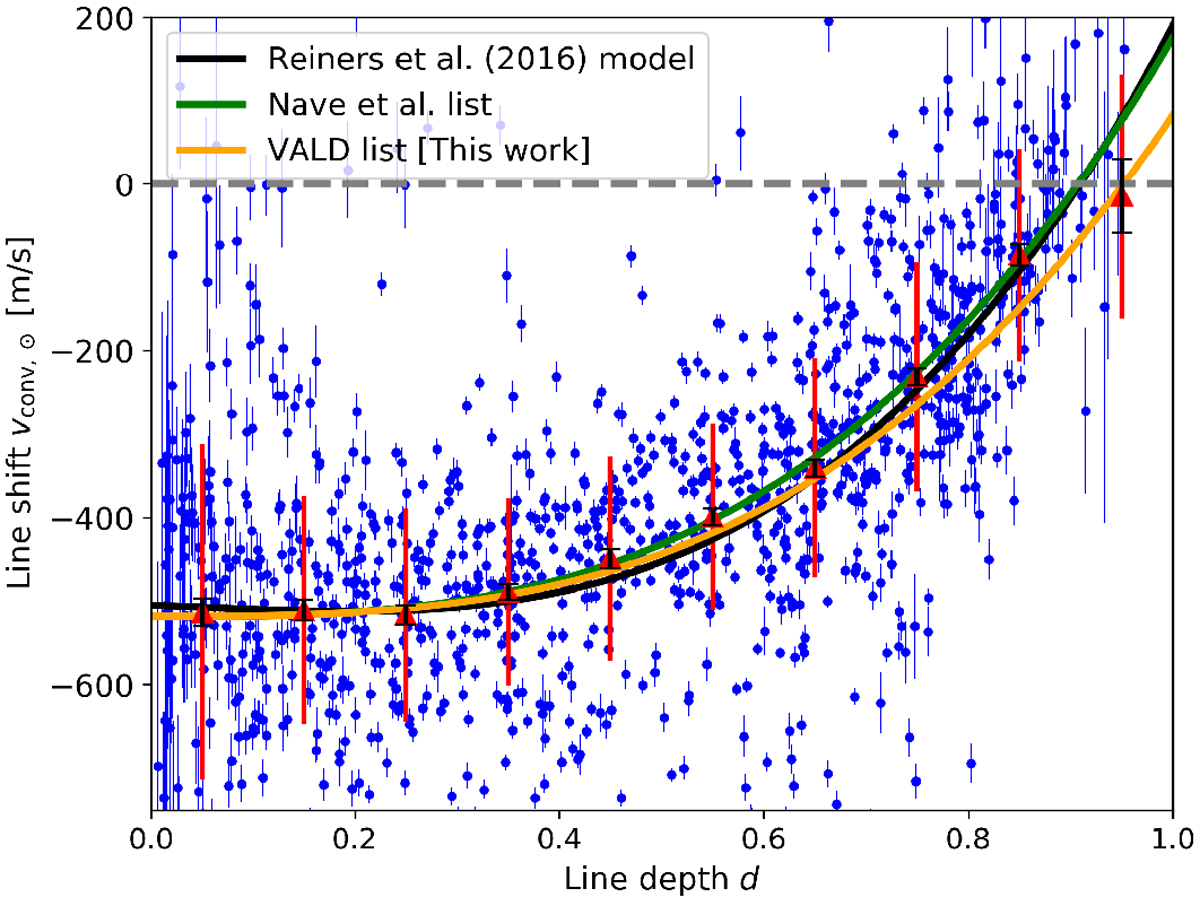
Third signature of granulation extracted from the IAG solar flux atlas. Blue dots with error bars mark the lines measured using the Nave et al. (1994) list, red triangles with bars are bin medians with MAD, black error bars show the error of the median. The black line is the model for the solar third signature from Reiners et al. (2016) based on the Nave et al. (1994) line list and the green line is the model from this work (Eq. (1)) based on the same. The orange line is our VALD-lines based template (Eq. (2)), shifted to match the intersection of the other two models at depth 0.15.
Current usage metrics show cumulative count of Article Views (full-text article views including HTML views, PDF and ePub downloads, according to the available data) and Abstracts Views on Vision4Press platform.
Data correspond to usage on the plateform after 2015. The current usage metrics is available 48-96 hours after online publication and is updated daily on week days.
Initial download of the metrics may take a while.