Free Access
Fig. D.1
Download original image
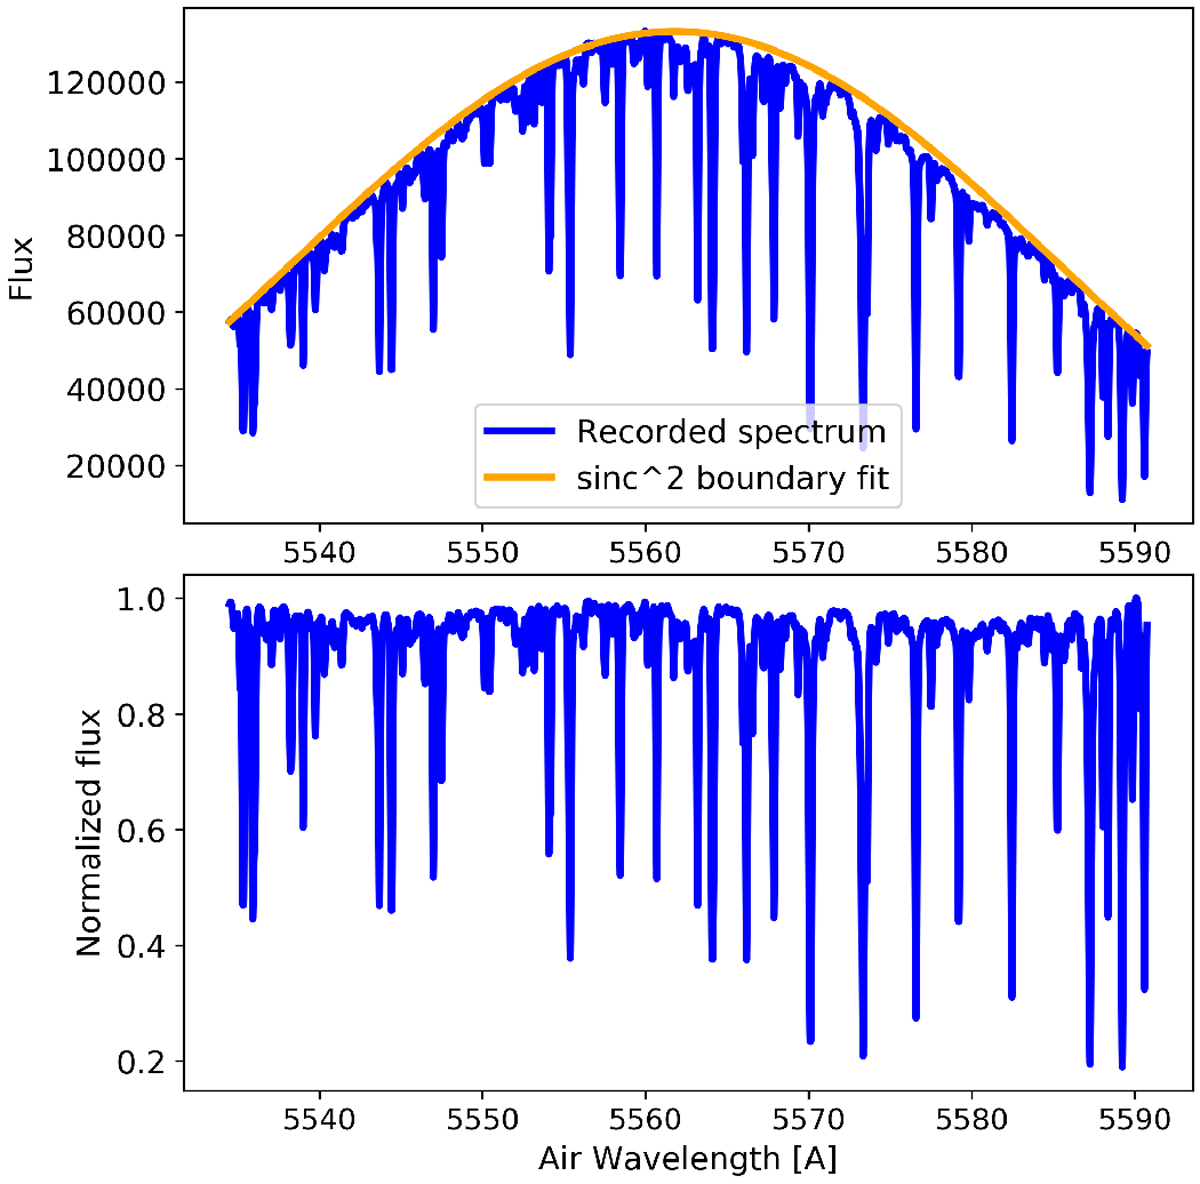
Example for the continuum normalization. Top: Example for a sinc2 boundary fit (orange curve) to the 50th recorded echelle order (blue curve) from GJ4340. Bottom: Normalized flux.
Current usage metrics show cumulative count of Article Views (full-text article views including HTML views, PDF and ePub downloads, according to the available data) and Abstracts Views on Vision4Press platform.
Data correspond to usage on the plateform after 2015. The current usage metrics is available 48-96 hours after online publication and is updated daily on week days.
Initial download of the metrics may take a while.