Fig. B.3
Download original image
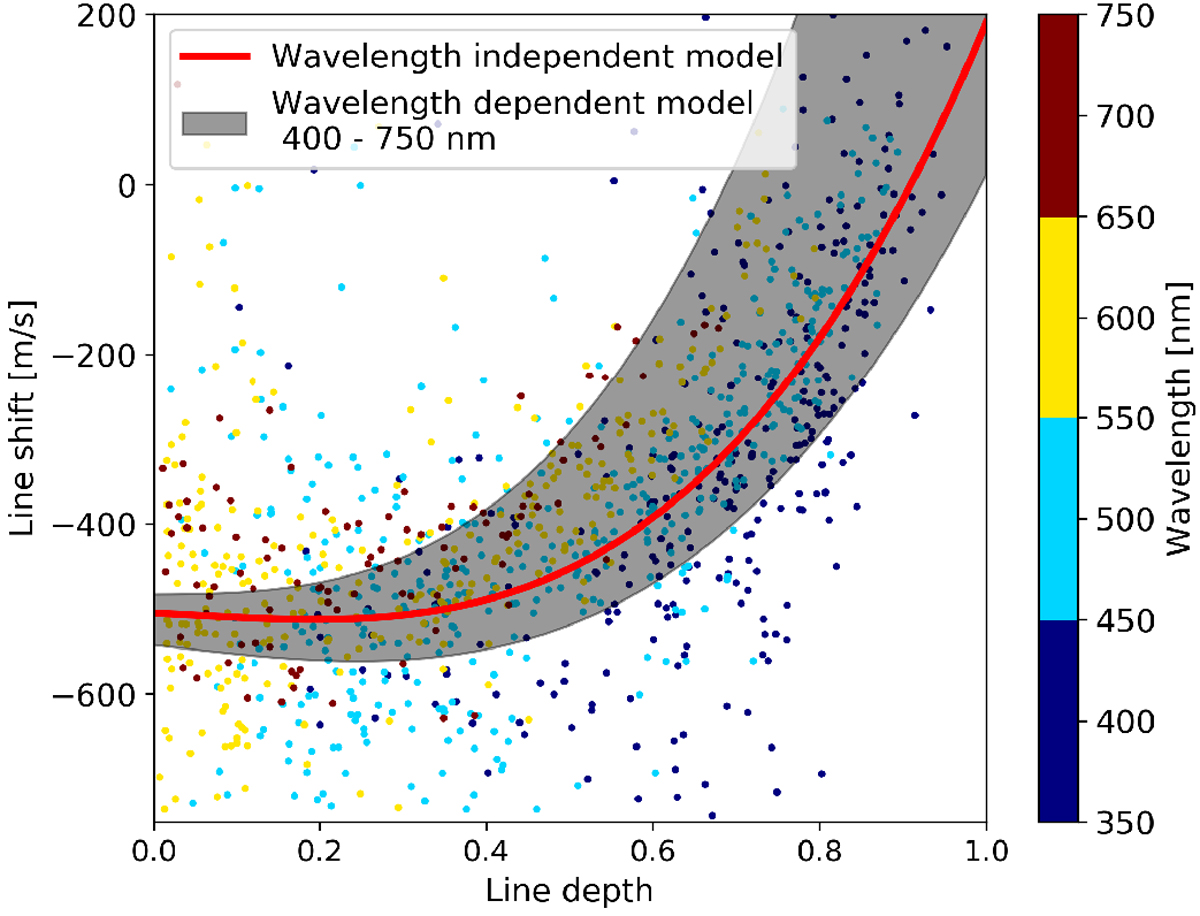
Fitted solar third signature as seen in Fig. 4 (red) that does not take the wavelength dependence into account and the revised model (black shaded) that does. Individual lines are color coded according to their wavelength. The lower boundary corresponds to a wavelength of 400 nm and the upper to 750 nm, covering the spectral range of the data. The individual lines’ measurements (blue) are shown without their error bars for visibility reasons. The revised model muchbetter captures the spread toward deeper lines.
Current usage metrics show cumulative count of Article Views (full-text article views including HTML views, PDF and ePub downloads, according to the available data) and Abstracts Views on Vision4Press platform.
Data correspond to usage on the plateform after 2015. The current usage metrics is available 48-96 hours after online publication and is updated daily on week days.
Initial download of the metrics may take a while.