Fig. B.2
Download original image
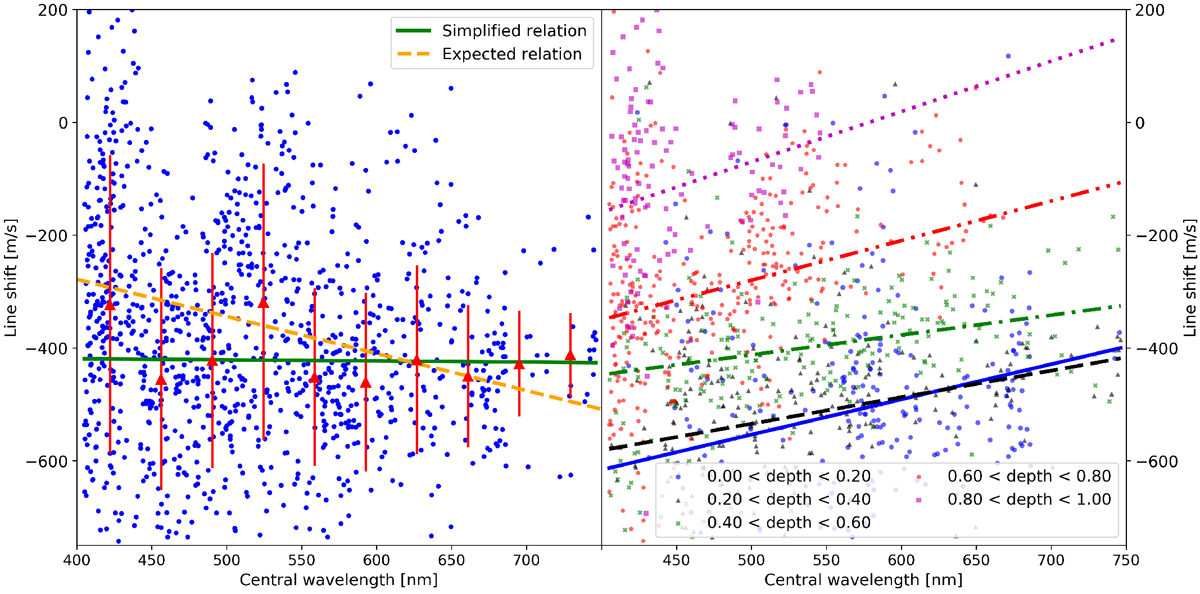
Two approaches to the wavelength dependence of CBS. Left: Simplified attempt at finding the dependence by directly plotting the line shift against the central wavelength (blue dots). Binning the data (red triangles with error bars) and applying a linear fit (green, continuous line) does not reveal any dependence. The orange, dashed line represents the expectation based on Figs. 4 and B.1 assuming lines at 400 nm to have an average depth about 0.7 and at 750 nm of about 0.2. Right: Depth-binned dependence of line shift on central wavelength. By largely removing the influence of line depth through binning, the actual wavelength effect becomes visible. The slopes of the binned wavelength effect compared to the depth distribution effect (left panel, dashed line) reveal an equal but opposite magnitude, accounting for the missing wavelength dependence in the simplified approach (left panel, solid line).
Current usage metrics show cumulative count of Article Views (full-text article views including HTML views, PDF and ePub downloads, according to the available data) and Abstracts Views on Vision4Press platform.
Data correspond to usage on the plateform after 2015. The current usage metrics is available 48-96 hours after online publication and is updated daily on week days.
Initial download of the metrics may take a while.