Fig. 1
Download original image
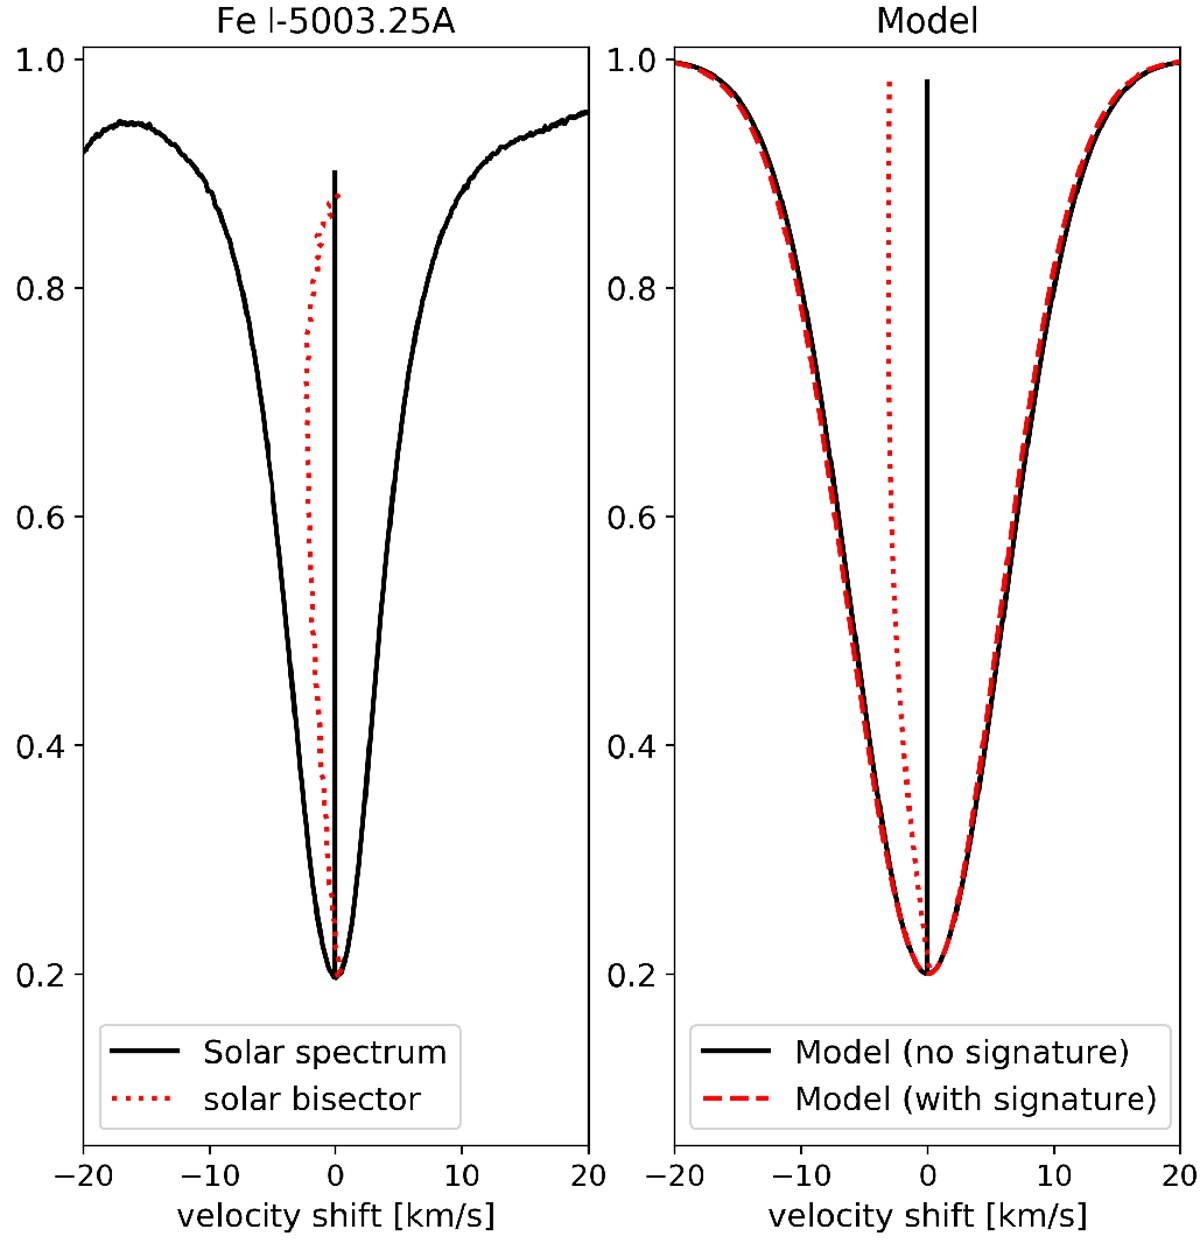
Comparison of a solar and a model spectral line bisector. Left: solar Fe I line at 5003.25 Å (solid black) with its center marked by a vertical line (solid black) from the IAG solar flux atlas (used as a template in this work) and the corresponding line bisector (dashed red). Right: Gaussian model line profile without (solid black) and with a solar-like third signature (dashed red, following Eq. (1)). Their respective bisectors are shown in the same colors. The model with the signature is shifted to match the line cores. In both panels, to emphasize the slight blueshift, the bisector scale is amplified by a factor of ten.
Current usage metrics show cumulative count of Article Views (full-text article views including HTML views, PDF and ePub downloads, according to the available data) and Abstracts Views on Vision4Press platform.
Data correspond to usage on the plateform after 2015. The current usage metrics is available 48-96 hours after online publication and is updated daily on week days.
Initial download of the metrics may take a while.