Fig. 5
Download original image
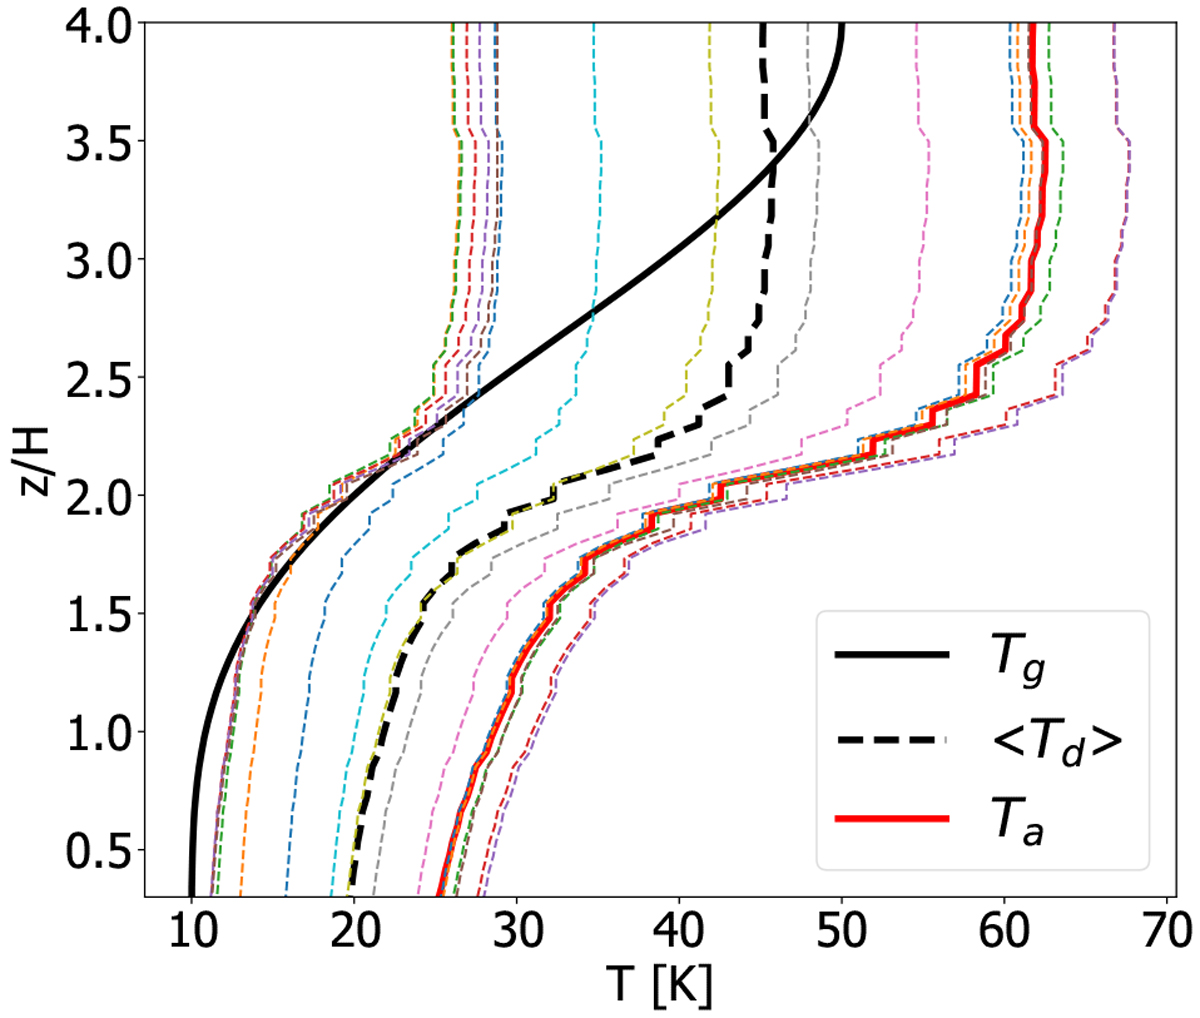
Vertical profiles of temperatures at 100 au. The thick black line is the gas vertical temperature profile in Kelvin. The dotted colored lines are temperatures of each grain population and the thick red line is the area-weighted temperature Ta. We see that temperatures are roughly constant for z∕H < 1.5 and for z∕H > 2.5. Between these two altitudes the temperatures exhibit a strong transition.
Current usage metrics show cumulative count of Article Views (full-text article views including HTML views, PDF and ePub downloads, according to the available data) and Abstracts Views on Vision4Press platform.
Data correspond to usage on the plateform after 2015. The current usage metrics is available 48-96 hours after online publication and is updated daily on week days.
Initial download of the metrics may take a while.