Open Access
Fig. C.4
Download original image
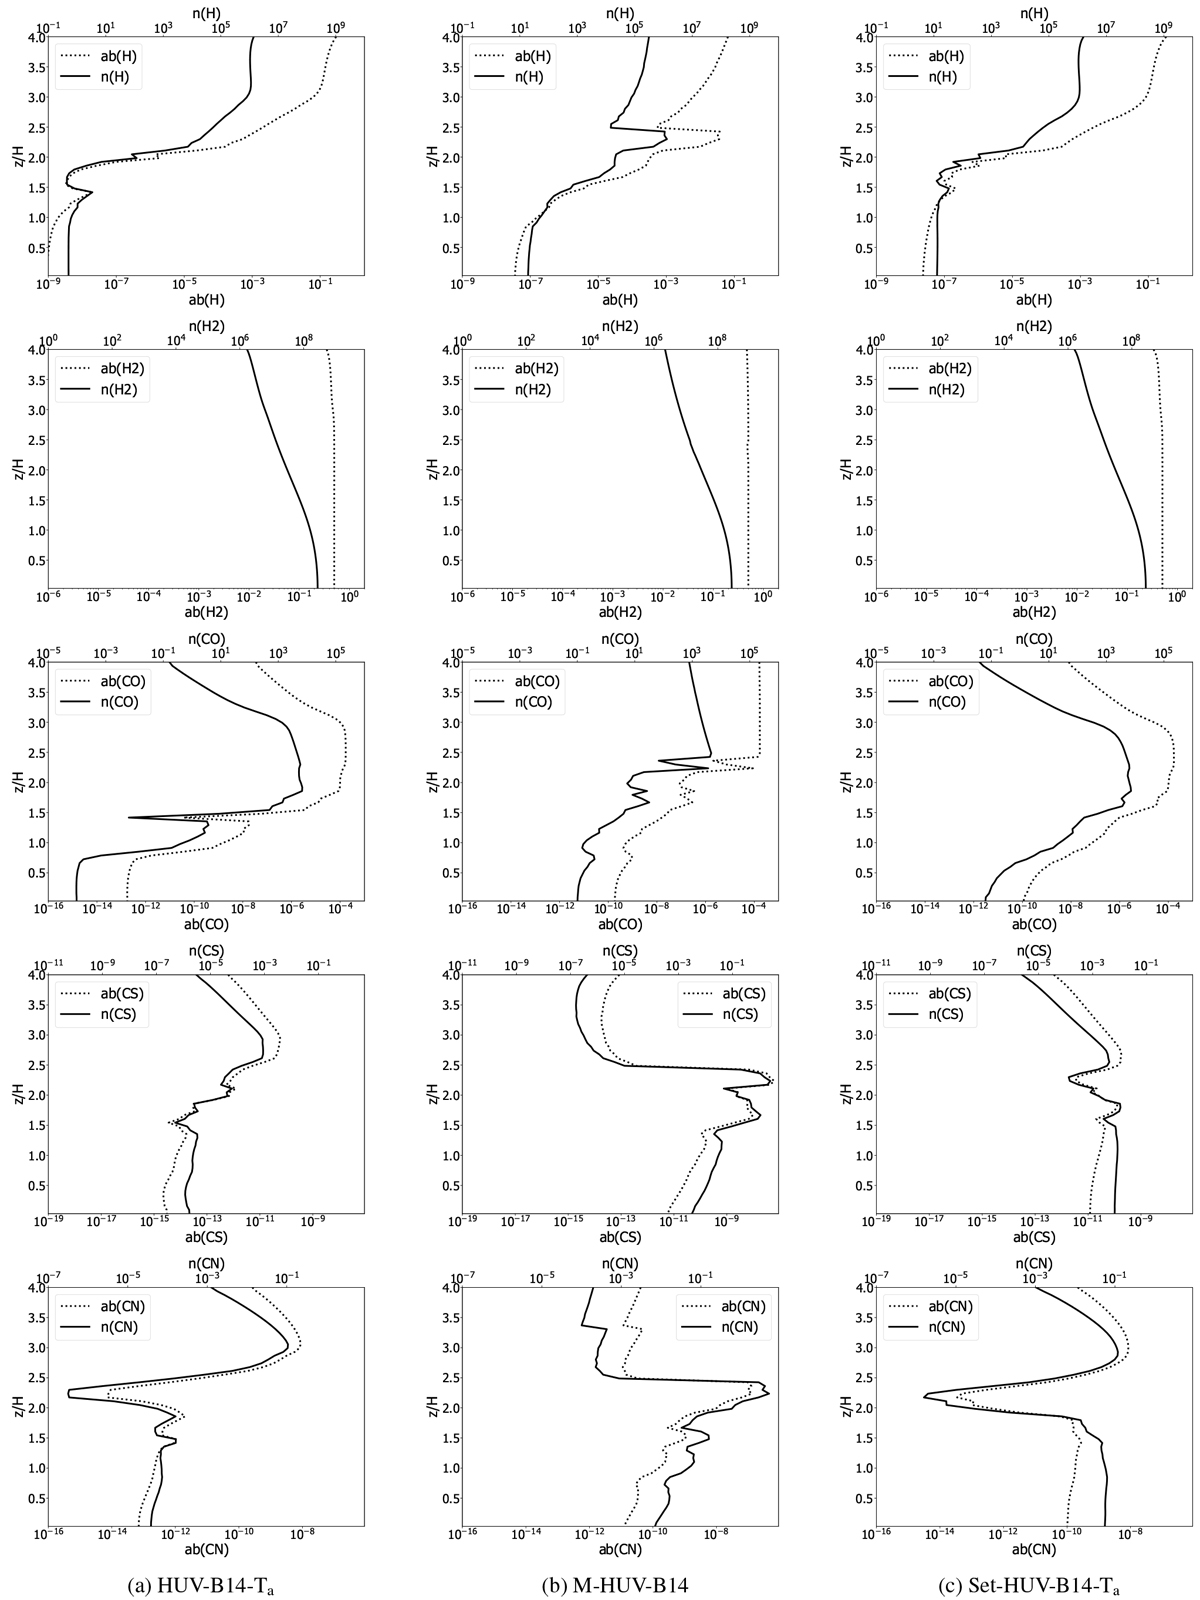
Vertical profiles of H, H2, CO, CS, and CN at 100 au from the star of the single-grain model HUV-B14-Ta (left), the multi-grain model M-HUV-B14 (middle), and the intermediate model Set-HUV-B14-Ta (right). The dotted line represents the abundance relative to H and the solid line represents the density [cm−3 ].
Current usage metrics show cumulative count of Article Views (full-text article views including HTML views, PDF and ePub downloads, according to the available data) and Abstracts Views on Vision4Press platform.
Data correspond to usage on the plateform after 2015. The current usage metrics is available 48-96 hours after online publication and is updated daily on week days.
Initial download of the metrics may take a while.