Fig. 20
Download original image
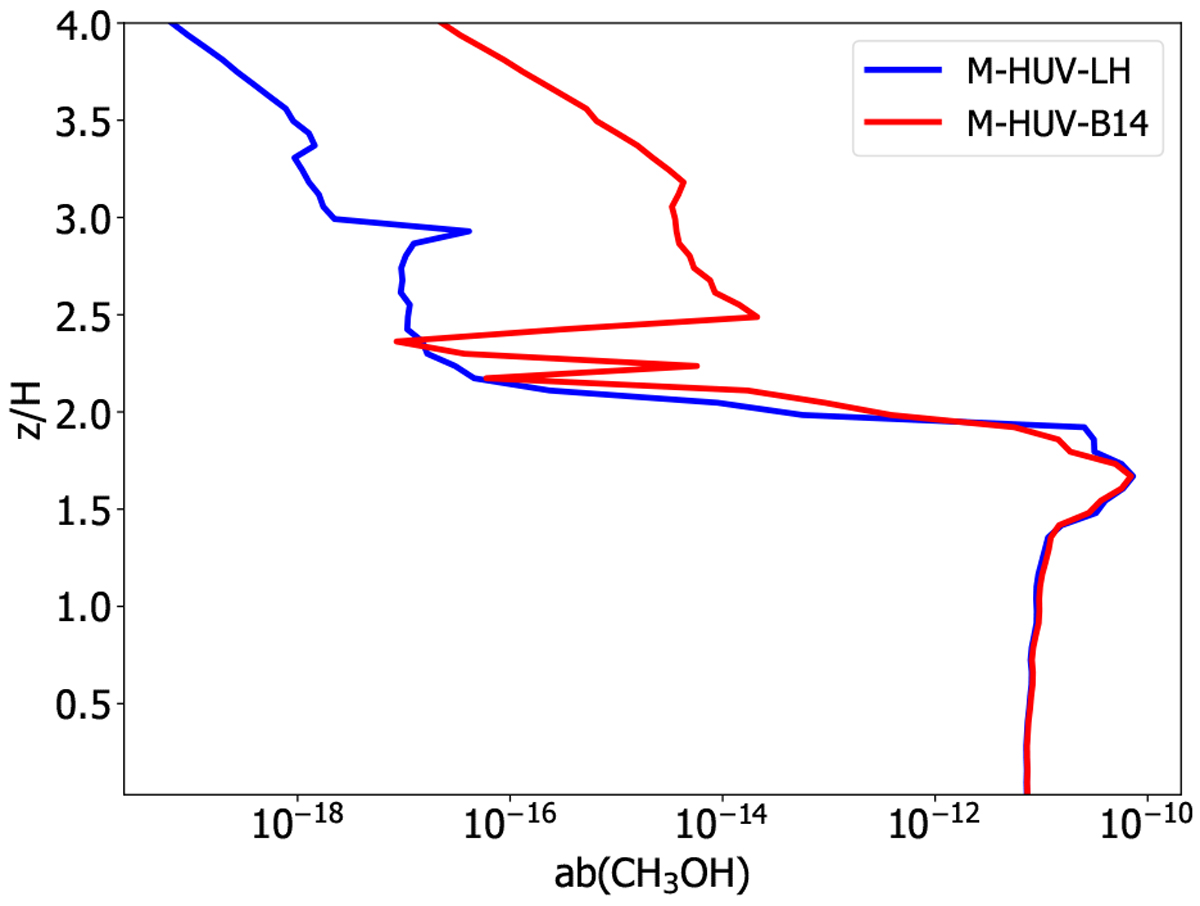
Altitude above the midplane as a function of the abundance relative to H of CH3OH at 100 au. The blue line shows the abundance produced by model M-HUV-LH; the red line shows the abundance produced by model M-HUV-B14. The abundance dramatically drops at ~ 2 scale heights in both models, although M-HUV-B14 maintains a larger abundance than M-HUV-LH at high altitudes.
Current usage metrics show cumulative count of Article Views (full-text article views including HTML views, PDF and ePub downloads, according to the available data) and Abstracts Views on Vision4Press platform.
Data correspond to usage on the plateform after 2015. The current usage metrics is available 48-96 hours after online publication and is updated daily on week days.
Initial download of the metrics may take a while.