Fig. 16
Download original image
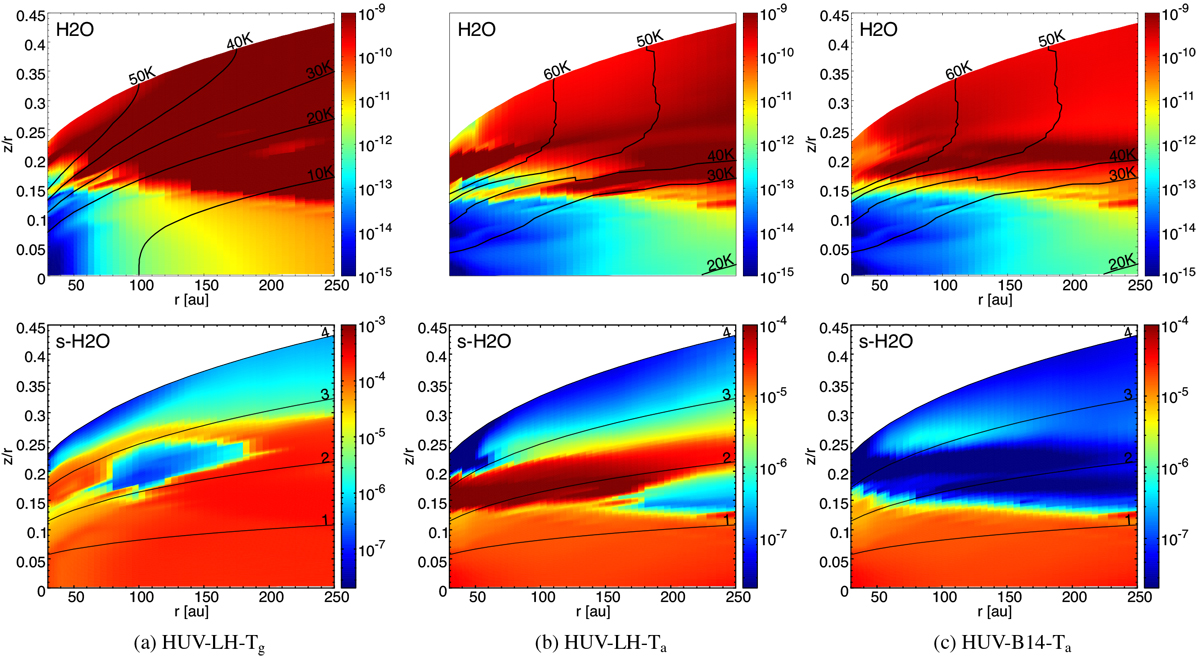
Water abundance in the gas phase (top) and on the grain surfaces (bottom) of the single-grain models. The left column shows the abundances in HUV-LH-Tg, middle in HUV-LH-Ta, and right in HUV-B14-Ta. In the top row, the solid black lines show the dust temperature isocontours; in the bottom row they denote isocontours of scale heights.
Current usage metrics show cumulative count of Article Views (full-text article views including HTML views, PDF and ePub downloads, according to the available data) and Abstracts Views on Vision4Press platform.
Data correspond to usage on the plateform after 2015. The current usage metrics is available 48-96 hours after online publication and is updated daily on week days.
Initial download of the metrics may take a while.