Open Access
Fig. 14
Download original image
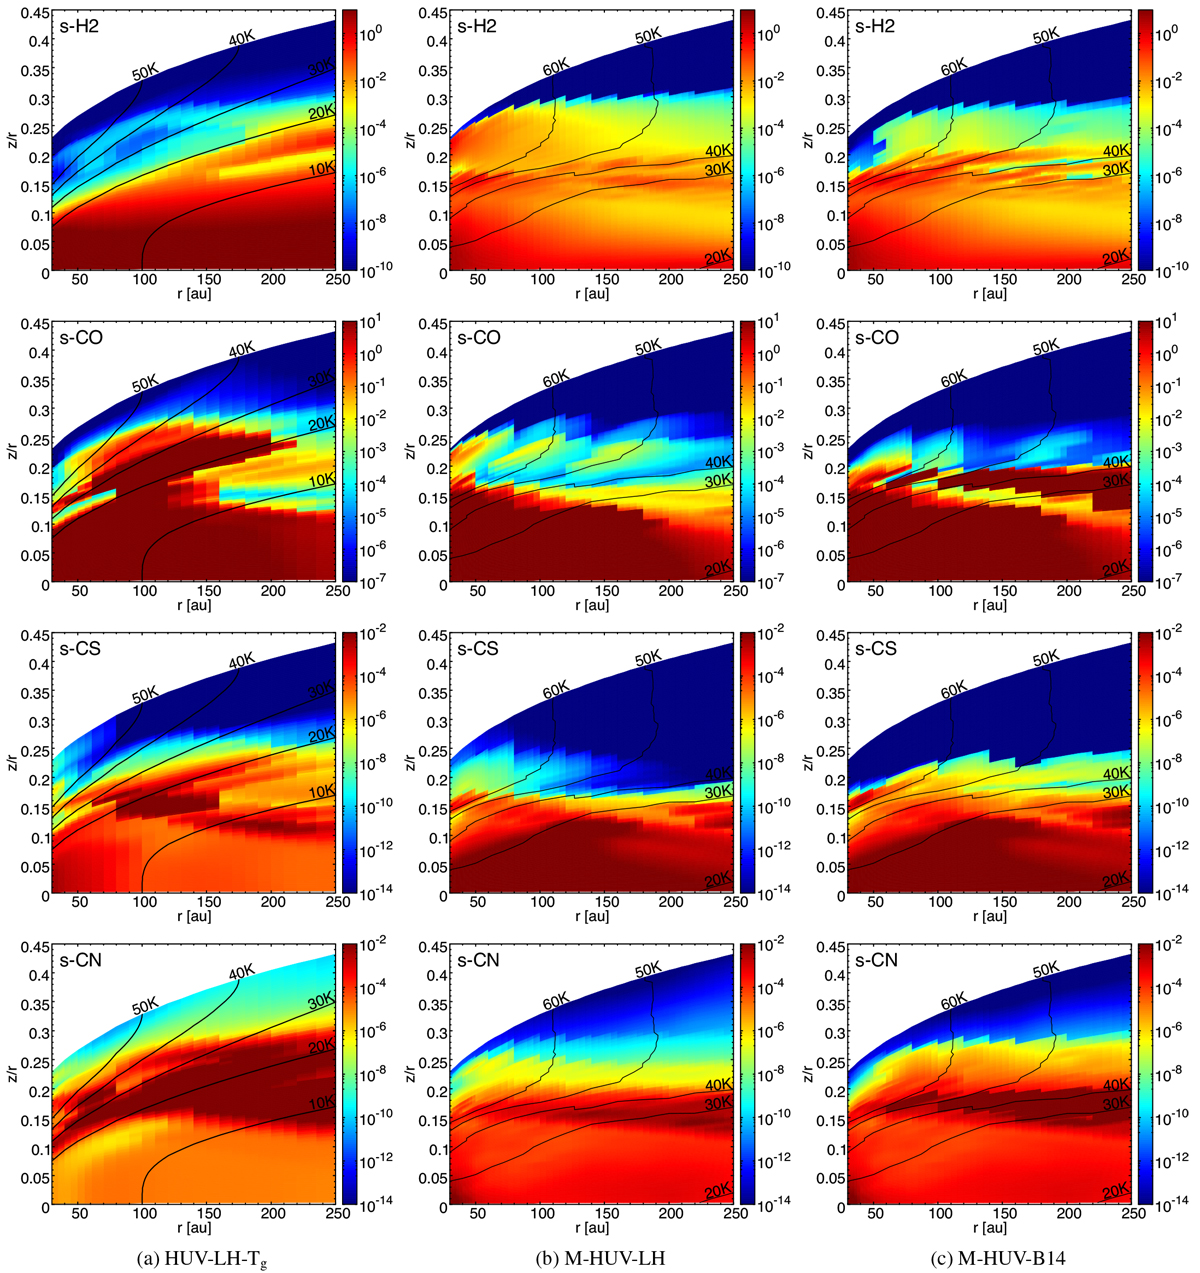
Density (cm−3) of H2, CO, CS and CN in the gas phase of HUV-LH-Tg (left column) and of the multi-grain models in HUV regime. The black contours represent the dust temperature (Td = Tg in the left column and Td = Ta in the middle and right columns).
Current usage metrics show cumulative count of Article Views (full-text article views including HTML views, PDF and ePub downloads, according to the available data) and Abstracts Views on Vision4Press platform.
Data correspond to usage on the plateform after 2015. The current usage metrics is available 48-96 hours after online publication and is updated daily on week days.
Initial download of the metrics may take a while.