Free Access
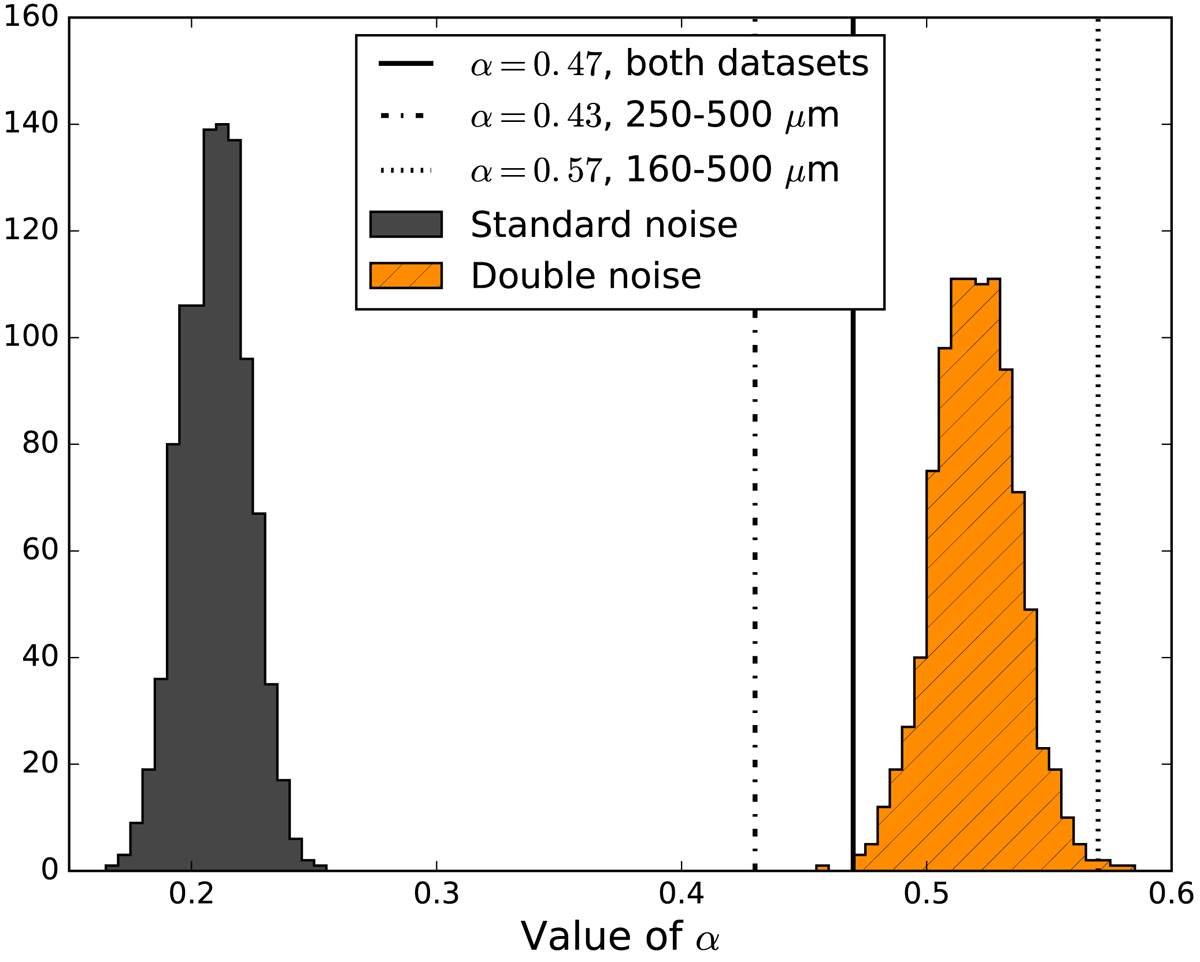
Fig. 7.
Download original image
Histogram of derived values of α using 1000 sets of 1000 SEDs each, with assumed observational noise (black) and double assumed noise (orange). Our derived relations are plotted with a black dotted line.
Current usage metrics show cumulative count of Article Views (full-text article views including HTML views, PDF and ePub downloads, according to the available data) and Abstracts Views on Vision4Press platform.
Data correspond to usage on the plateform after 2015. The current usage metrics is available 48-96 hours after online publication and is updated daily on week days.
Initial download of the metrics may take a while.