Fig. 5.
Download original image
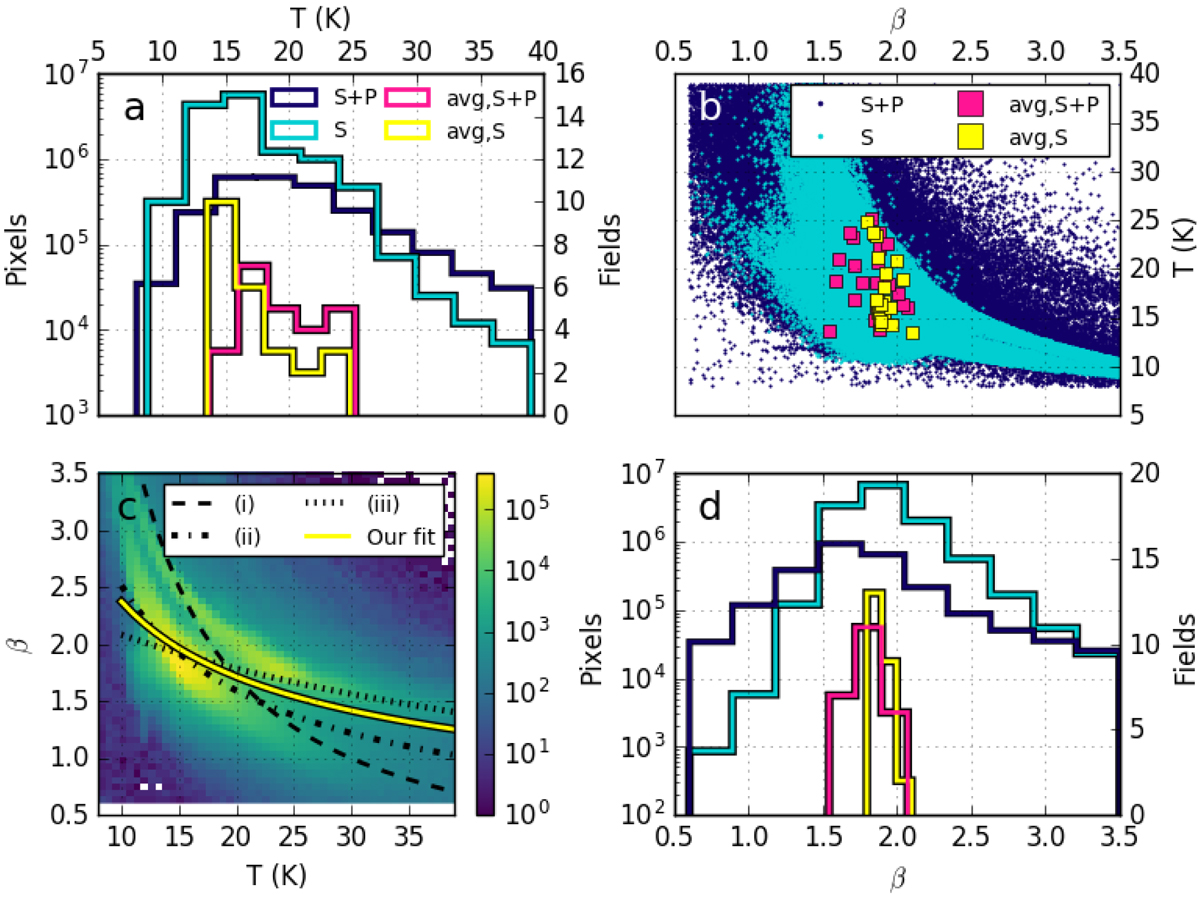
(a) Histogram of field temperature. (b) Spectral index plotted against temperature. (c) 2D histogram of temperature plotted against spectral index. (d) Histogram of field spectral index. The values are calculated from background-subtracted data in the ranges 250–500 μm (light blue, S) and 160–500 μm (dark blue, S+P). In frames a and d, these histograms correspond to the left-hand y-axis. Every tenth value of those pixels with 9 < T < 39 K and 0.6 < β < 3.4 is included in frame b and every pixel in the other frames. Yellow and pink stand for averages of each field (n = 24) with the four-map (avg, S+P) and three-map (avg, S) combinations, respectively, and in frames a and d correspond to the right-hand y-axis. β-T relations from the literature are also plotted in (c), where (i) β = 1.71 × (T/20 K)−1.33 (Paradis et al. 2010), dashed line, (ii) β = 11.5 × T−0.66 (Désert et al. 2008), dash-dotted line, and (iii) β = 1/(0.4 + 0.008 × T) (Dupac et al. 2003), dotted line. The relation derived for our data is plotted on frame c in yellow.
Current usage metrics show cumulative count of Article Views (full-text article views including HTML views, PDF and ePub downloads, according to the available data) and Abstracts Views on Vision4Press platform.
Data correspond to usage on the plateform after 2015. The current usage metrics is available 48-96 hours after online publication and is updated daily on week days.
Initial download of the metrics may take a while.