Fig. 4.
Download original image
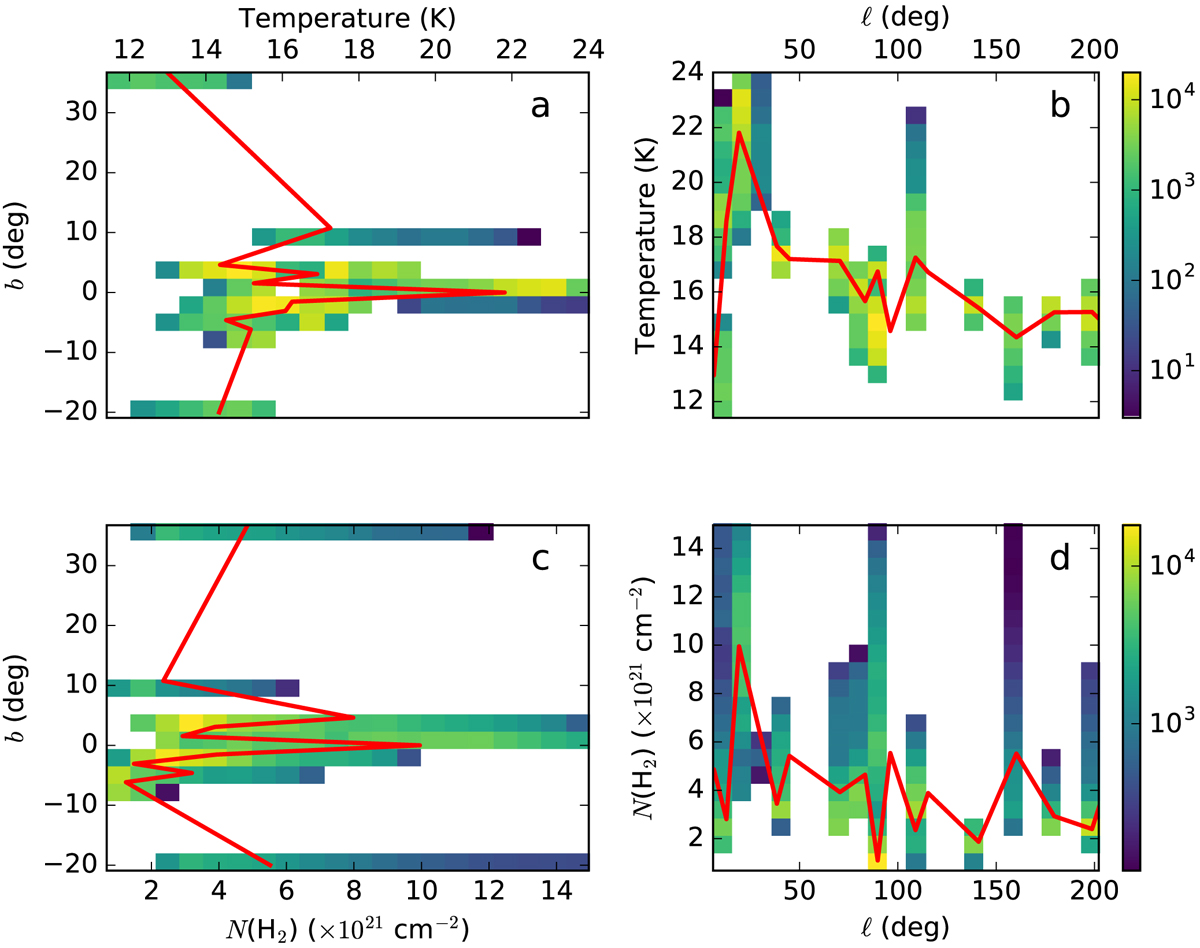
Average properties of the 53 fields. The frames show 2D histograms of (a) temperature plotted against Galactic latitude b, (b) temperature plotted against Galactic longitude ℓ, (c) column density plotted against Galactic latitude b, and (d) column density plotted against Galactic longitude ℓ. The red line plots the averages for each bin. The plots are based on fits to SPIRE data only.
Current usage metrics show cumulative count of Article Views (full-text article views including HTML views, PDF and ePub downloads, according to the available data) and Abstracts Views on Vision4Press platform.
Data correspond to usage on the plateform after 2015. The current usage metrics is available 48-96 hours after online publication and is updated daily on week days.
Initial download of the metrics may take a while.