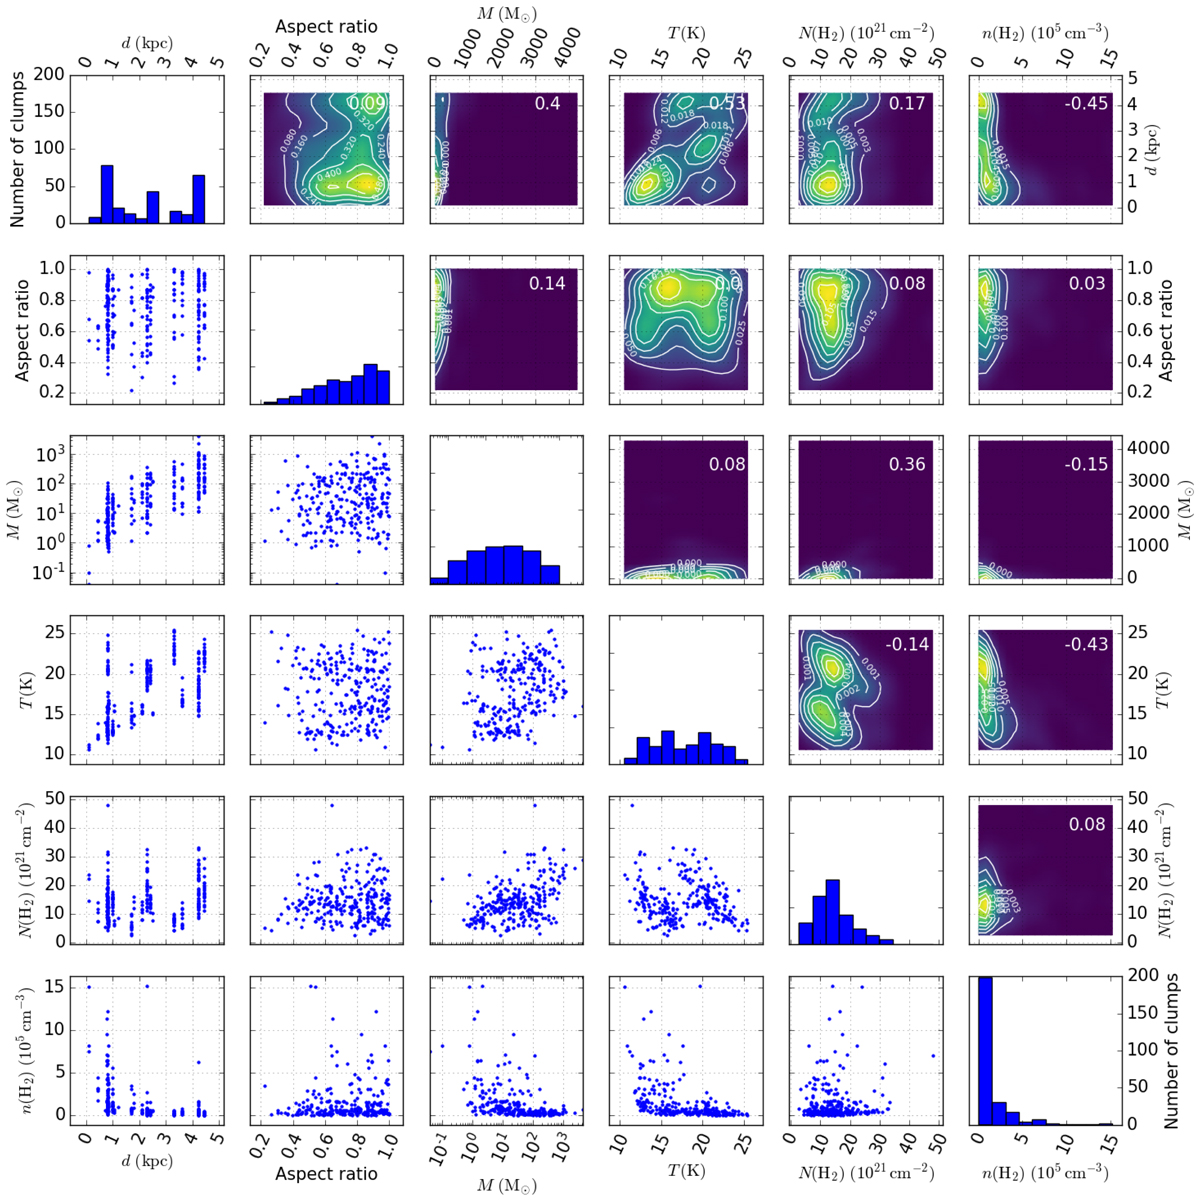
Fig. M.1.
Download original image
Histograms of clump distance, aspect ratio (minor/major axis), mass, temperature, column density N(H2), and number density n are shown on the diagonal, with scatter plots relating each parameter to each other on the lower frames. The upper frames show a contour plot of the same relation; the correlation coefficient is quoted in the frame. These values are derived using SPIRE data with constant β = 1.8. In this figure, 242 clumps with distance estimates and SPIRE data are included. Mass has a logarithmic scale for only the histogram and scatter plots.
Current usage metrics show cumulative count of Article Views (full-text article views including HTML views, PDF and ePub downloads, according to the available data) and Abstracts Views on Vision4Press platform.
Data correspond to usage on the plateform after 2015. The current usage metrics is available 48-96 hours after online publication and is updated daily on week days.
Initial download of the metrics may take a while.