Free Access
Fig. I.1.
Download original image
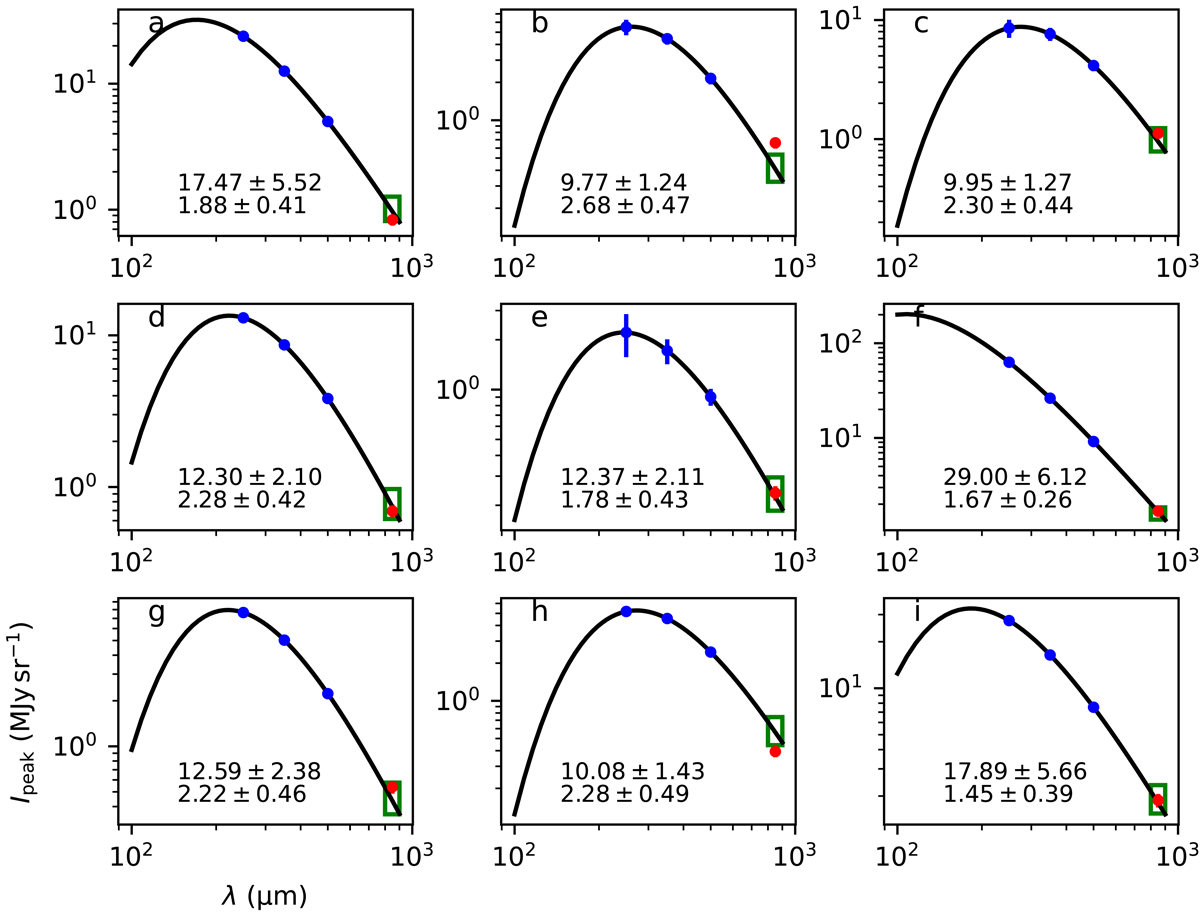
SEDs of the peak pixels of nine randomly-selected clumps with S/N > 3 in all bands. The blue dots are at 250, 350, and 500 μm, respectively. The green box indicates the 5%-95% confidence interval of the extrapolated 850 μm value, and the red dot the observed value at 850 μm.
Current usage metrics show cumulative count of Article Views (full-text article views including HTML views, PDF and ePub downloads, according to the available data) and Abstracts Views on Vision4Press platform.
Data correspond to usage on the plateform after 2015. The current usage metrics is available 48-96 hours after online publication and is updated daily on week days.
Initial download of the metrics may take a while.