Fig. 4
Download original image
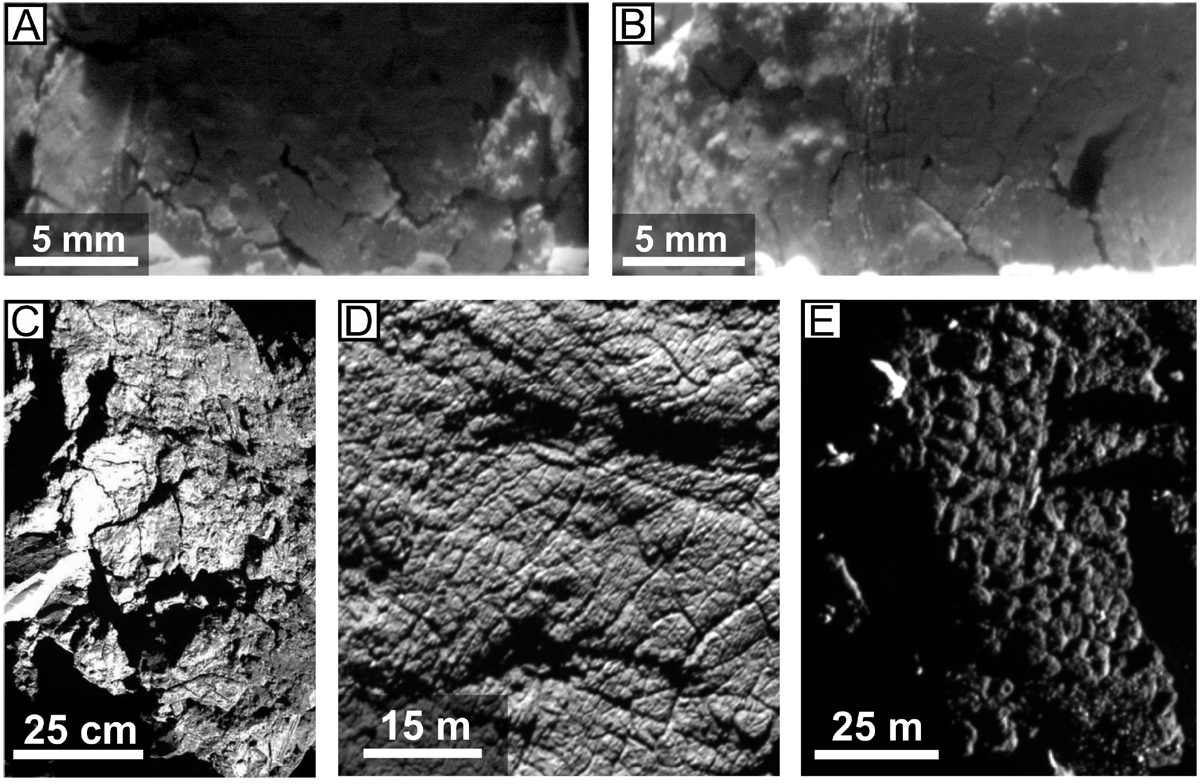
Comparison of fractures generated in the laboratory (panels A and B) and observed on 67P (panels C–E). Panel A: close-up of the sample with the lowest dust fraction (10:100:300) from Fig. 3. Distinct and irregularly shaped fractures form a poorly developed network on the side wall of the sample. Panel B: enlarged section of the sample with the highest dust content (10:100:700) from Fig. 3. The length and pattern of evolving fractures are comparable to those on samples with lower dust content, but they are significantly narrower. Panel C: detailed image of fractures on the surface of 67P, taken by the Philae lander. Several irregular cracks are visible on a rough and dust-free surface. The fracture patterns correspond most closely to those on panel B. Image credit: ESA/Rosetta/Philae/CIVA. Panel D: fracture network on the surface of 67P. The fractures form a pattern of polygons with widths of up to 5 m. Panel E: evolved polygonal structures, caused by fractures on the surface of 67P. Image credits: ESA/Rosetta/MPS for OSIRIS Team MPS/UPD/LAM/IAA/SSO/INTA/UPM/DASP/IDA.
Current usage metrics show cumulative count of Article Views (full-text article views including HTML views, PDF and ePub downloads, according to the available data) and Abstracts Views on Vision4Press platform.
Data correspond to usage on the plateform after 2015. The current usage metrics is available 48-96 hours after online publication and is updated daily on week days.
Initial download of the metrics may take a while.