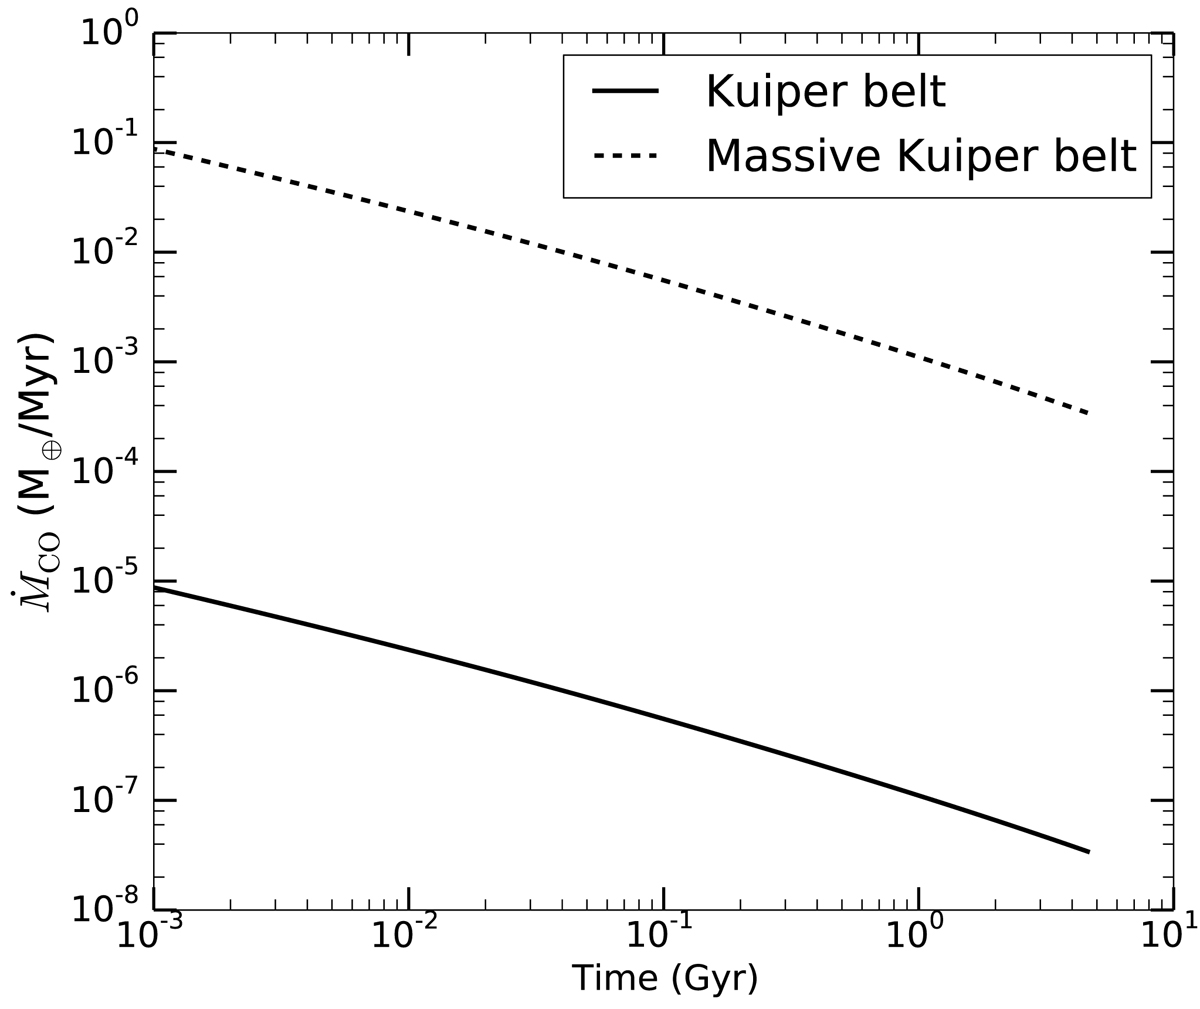
Fig. 1.
Download original image
CO gas production rate in the KB ṀCO as a function of time as predicted by our sublimation model (see Appendix A); t = 0 is when the gas release starts, i.e., probably after a few to 10 megayears, and the end of the lines on the right is today. The solid line is for the KB, assuming it starts with a low mass similar to the current KB mass, and the dashed line is for a more massive belt similar to the archetype β Pic belt.
Current usage metrics show cumulative count of Article Views (full-text article views including HTML views, PDF and ePub downloads, according to the available data) and Abstracts Views on Vision4Press platform.
Data correspond to usage on the plateform after 2015. The current usage metrics is available 48-96 hours after online publication and is updated daily on week days.
Initial download of the metrics may take a while.