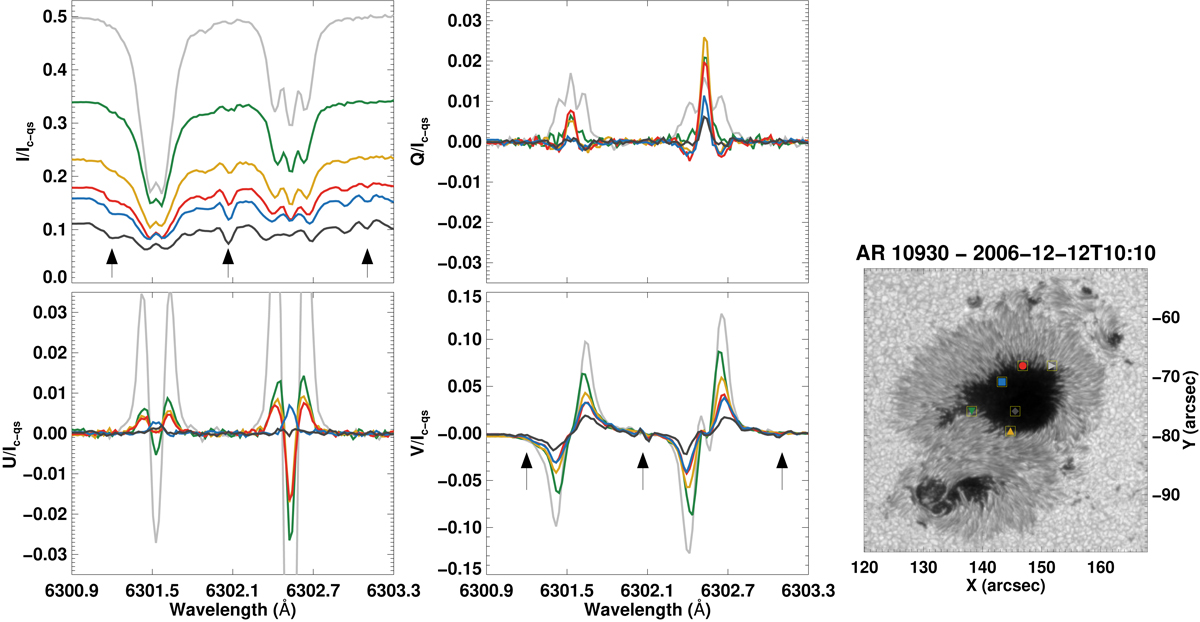
Fig. A.1.
Download original image
Hinode/SOT-SP observations at μ = 0.99 of the sunspot AR 10930. Its image at continuum wavelength is shown on the right. We have chosen six pixels, marked using squares on the image, representing different parts of the Sunspot and plotted their Stokes profiles. They sample regions with continuum intensities ranging from the darkest umbra to 0.5 Iqs. The profiles clearly show how the 6301.5 Å and the 6302.5 Å lines become increasingly weaker with decreasing continuum intensity, while at the same time blending by most probably molecular lines increases rapidly. Arrows mark three prominent molecular lines.
Current usage metrics show cumulative count of Article Views (full-text article views including HTML views, PDF and ePub downloads, according to the available data) and Abstracts Views on Vision4Press platform.
Data correspond to usage on the plateform after 2015. The current usage metrics is available 48-96 hours after online publication and is updated daily on week days.
Initial download of the metrics may take a while.