Fig. 7.
Download original image
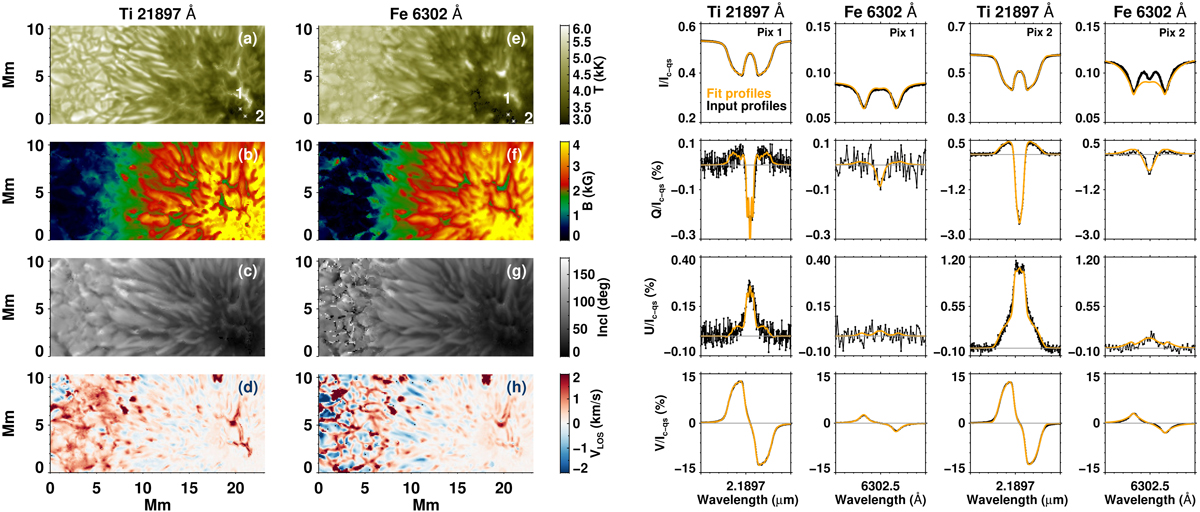
Atmospheric maps from the inversion of iron and titanium lines. Left: maps of the temperature (a, e), magnetic field strength (b, f), inclination (c, g), and LOS velocity (d, h) at log(τ) = − 0.8, obtained by inverting the Ti I 21 897 Å (first column) and Fe I 6302 Å (second column) lines. In the LOS velocity maps, blue indicates upflows and red downflows. Right: fit to the degraded Stokes profiles of the Ti and Fe lines at two sample pixels marked on the temperature maps.
Current usage metrics show cumulative count of Article Views (full-text article views including HTML views, PDF and ePub downloads, according to the available data) and Abstracts Views on Vision4Press platform.
Data correspond to usage on the plateform after 2015. The current usage metrics is available 48-96 hours after online publication and is updated daily on week days.
Initial download of the metrics may take a while.