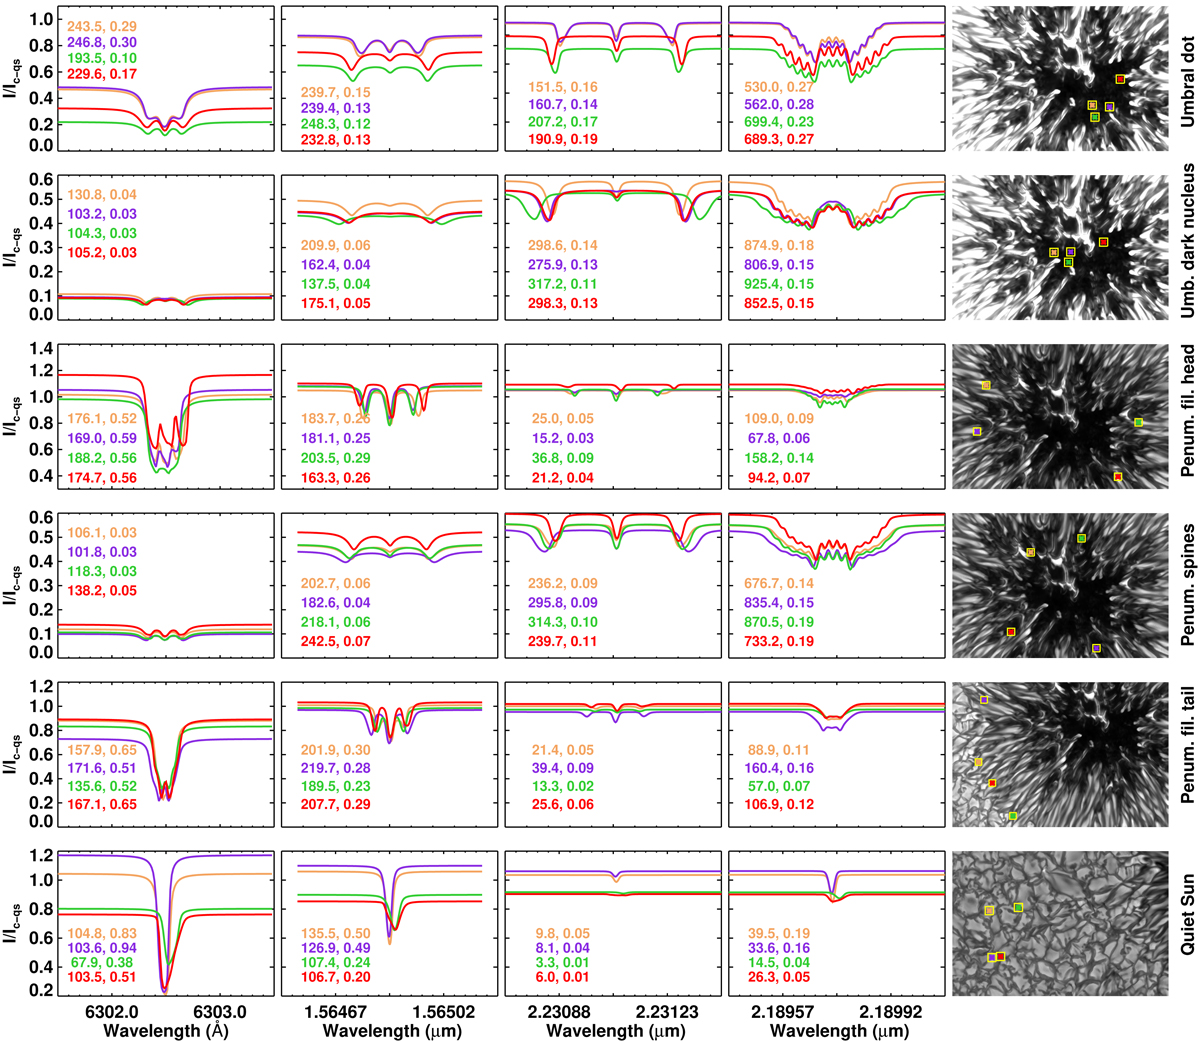
Fig. 4.
Download original image
Stokes I profiles from different features of the sunspot and the quiet Sun. From top to bottom: umbral dots, dark umbral core, penumbral filament head, spine in penumbra, penumbral filament tail, and quiet Sun. At each feature, we show profiles from four sample pixels and indicate the equivalent widths (in mÅ) and normalized line depths. These pixels are at the centers of the squares marked on the images in the last column. The profiles are shown for both the Fe I and the Ti I spectral lines. They are normalized to the spatially averaged quiet Sun continuum intensity (Ic − qs). The contrast on the last column was adapted for better representation of the different features.
Current usage metrics show cumulative count of Article Views (full-text article views including HTML views, PDF and ePub downloads, according to the available data) and Abstracts Views on Vision4Press platform.
Data correspond to usage on the plateform after 2015. The current usage metrics is available 48-96 hours after online publication and is updated daily on week days.
Initial download of the metrics may take a while.