Fig. 3.
Download original image
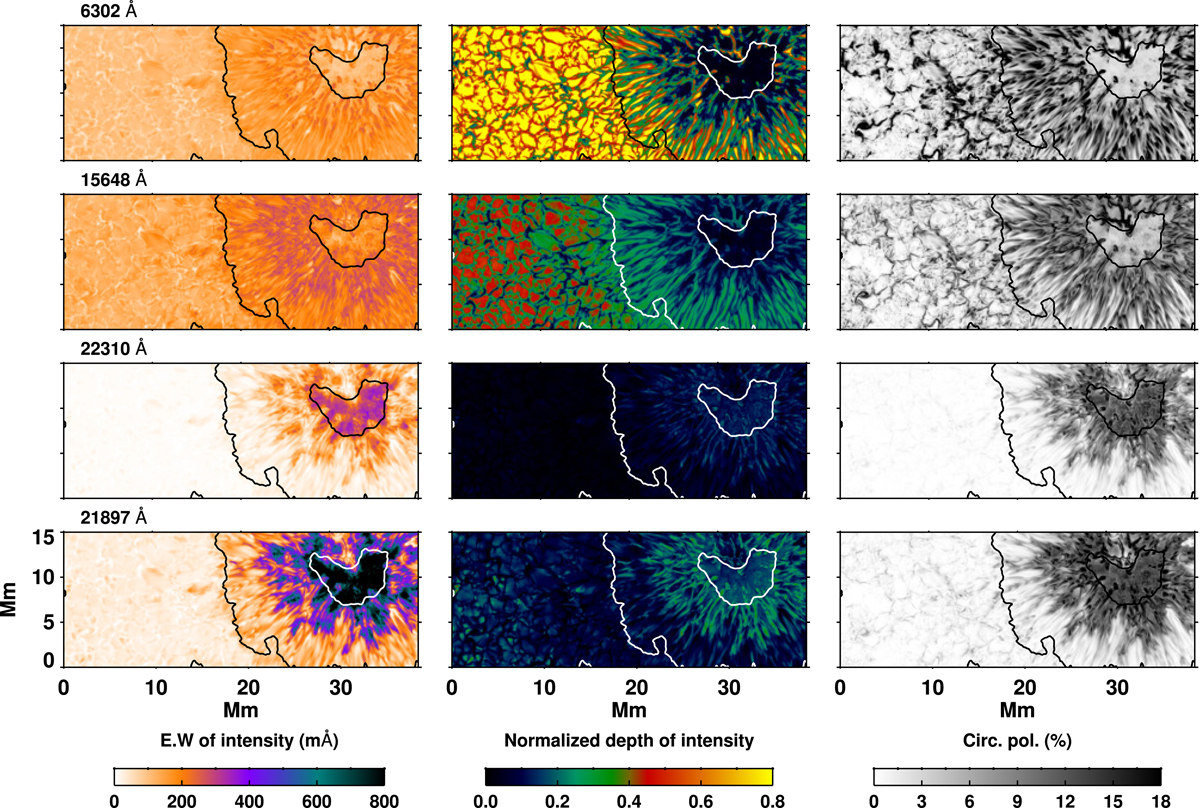
First and second columns: maps of the equivalent widths and normalized line depths of the intensity profiles. Last columns: maps of maximum circular polarization. All quantities are plotted for four lines the Fe I 6302.5 Å and 1.56 μm lines (top panels), and the Ti I 22 310 Å, and 21 897 Å lines (bottom panels). Contours mark the penumbra-umbra and penumbra-quiet sun boundaries.
Current usage metrics show cumulative count of Article Views (full-text article views including HTML views, PDF and ePub downloads, according to the available data) and Abstracts Views on Vision4Press platform.
Data correspond to usage on the plateform after 2015. The current usage metrics is available 48-96 hours after online publication and is updated daily on week days.
Initial download of the metrics may take a while.