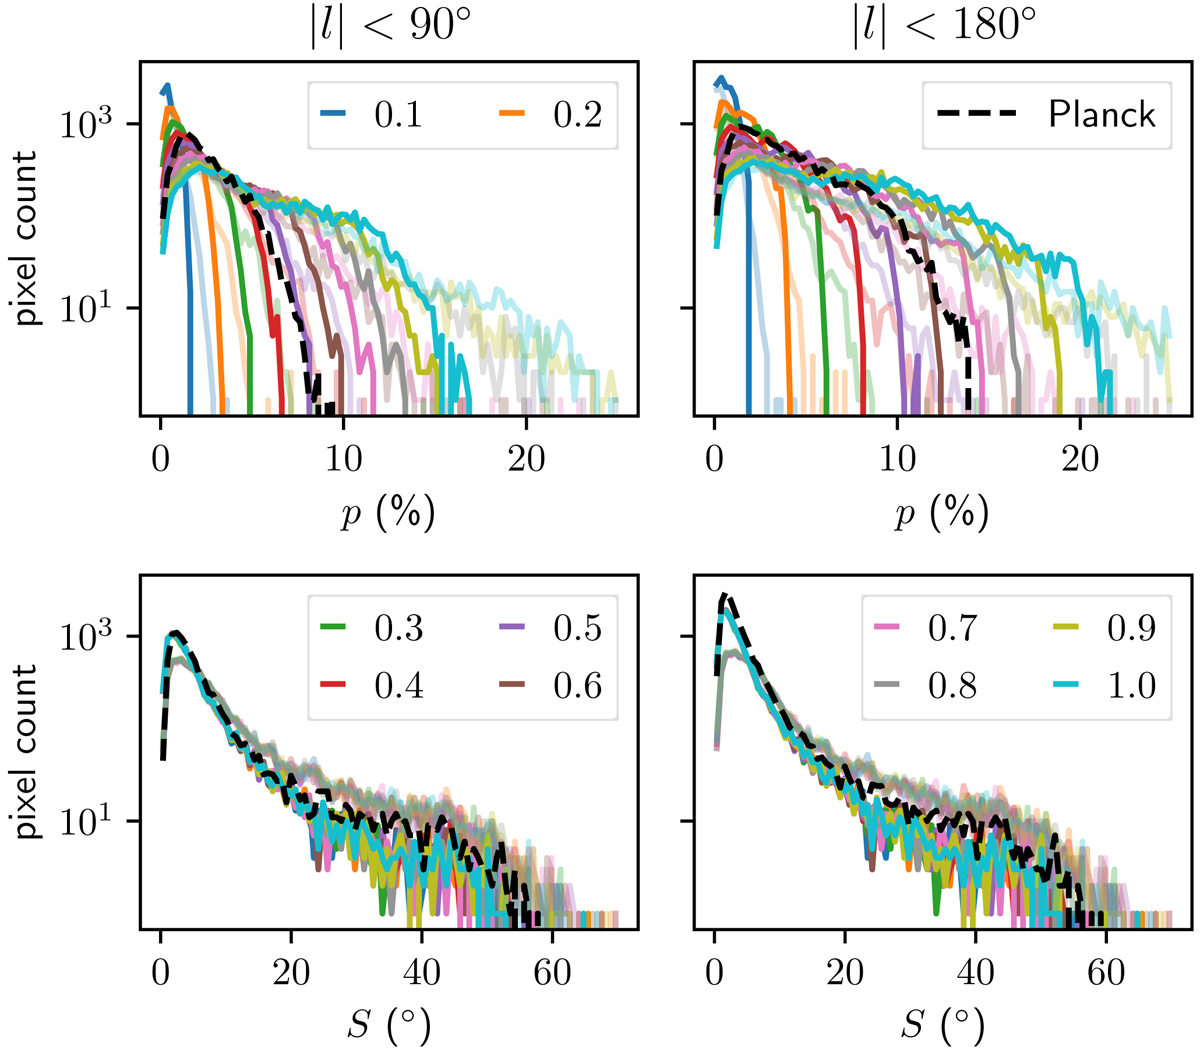
Fig. 9.
Download original image
Histograms of the linear polarisation fraction (top) and angular dispersion function (bottom) for the Auriga 6 model and the observer at the low density position in the outer annulus. Only pixels in the thin disc with |b| < 5° are shown. The different colours correspond to different values of the alignment fraction fS, A, as indicated in the legend. The full lines are the models that use dust allocation recipe recT12, while the shaded lines are the models with dust allocation recipe recSF8000. The black dashed lines are the corresponding Planck histograms.
Current usage metrics show cumulative count of Article Views (full-text article views including HTML views, PDF and ePub downloads, according to the available data) and Abstracts Views on Vision4Press platform.
Data correspond to usage on the plateform after 2015. The current usage metrics is available 48-96 hours after online publication and is updated daily on week days.
Initial download of the metrics may take a while.