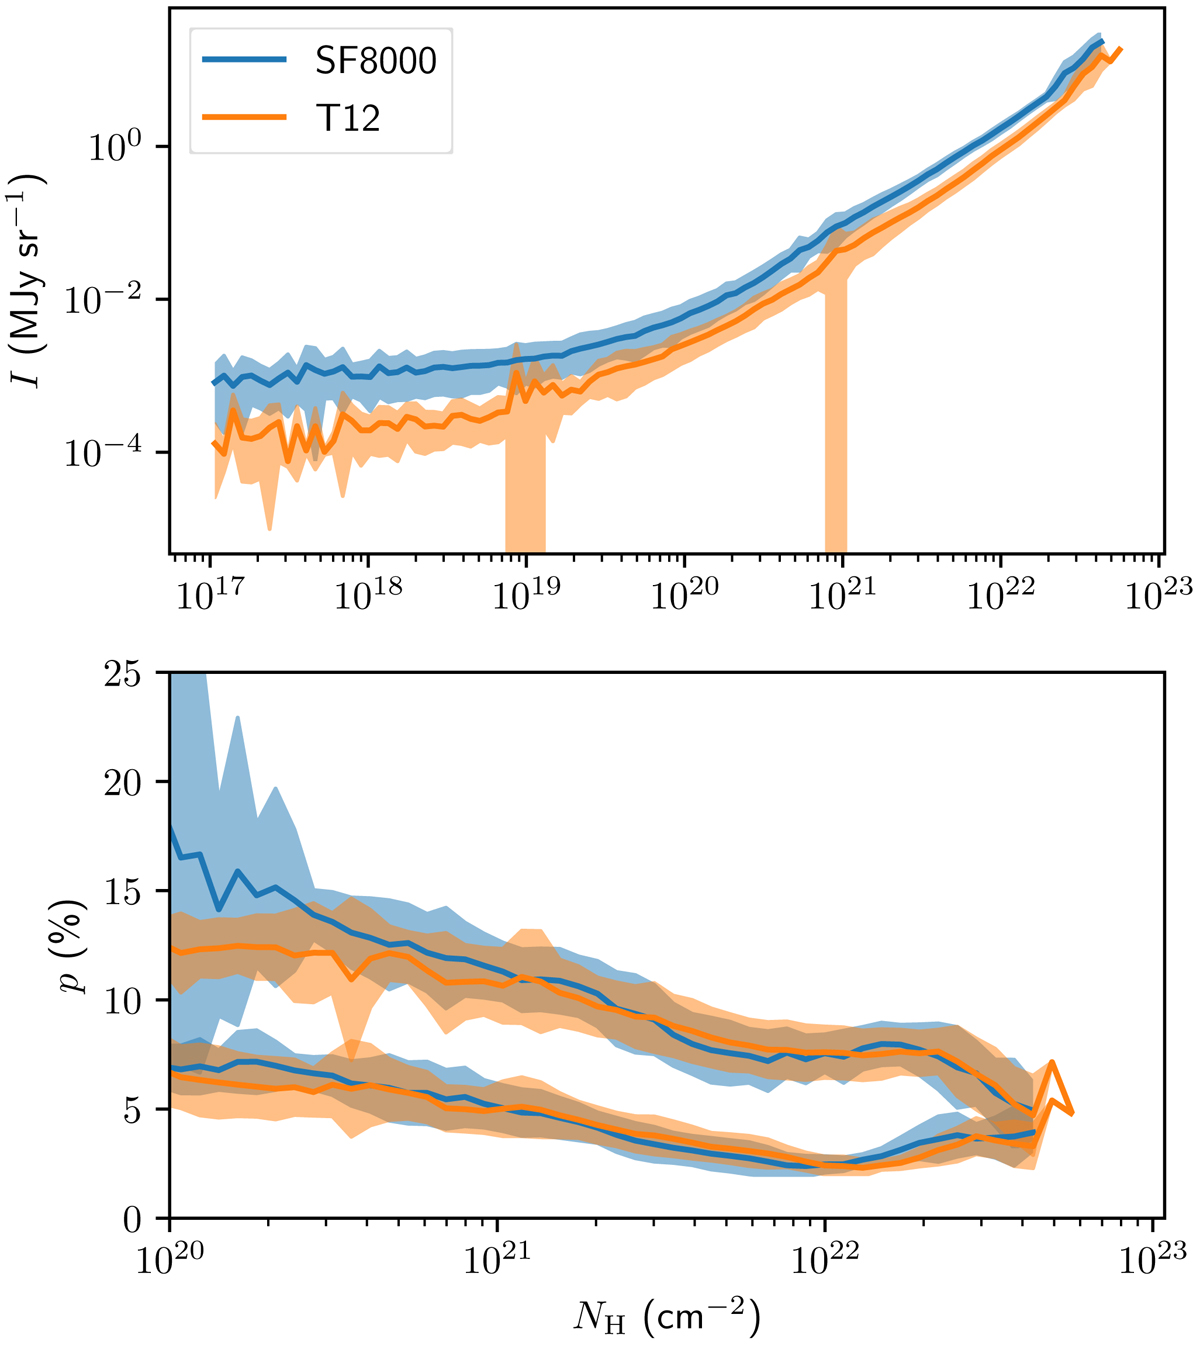
Fig. 8.
Download original image
Total intensity (top) and linear polarisation fraction (bottom) as a function of hydrogen column density. All values have been binned within 100 logarithmic bins in NH. The solid lines always indicate the average of the binned quantity over all six halos and all four observer positions, while the shaded regions indicate the standard deviation across the halos and positions. Different colours correspond to different dust allocation recipes, as indicated in the legend. Top panel: binned quantity is the average total intensity. Bottom panel: the binned quantities for the lower and upper lines correspond to respectively the mean linear polarisation fraction and the 99% percentile of the linear polarisation fraction in the bin.
Current usage metrics show cumulative count of Article Views (full-text article views including HTML views, PDF and ePub downloads, according to the available data) and Abstracts Views on Vision4Press platform.
Data correspond to usage on the plateform after 2015. The current usage metrics is available 48-96 hours after online publication and is updated daily on week days.
Initial download of the metrics may take a while.