Free Access
Fig. 5.
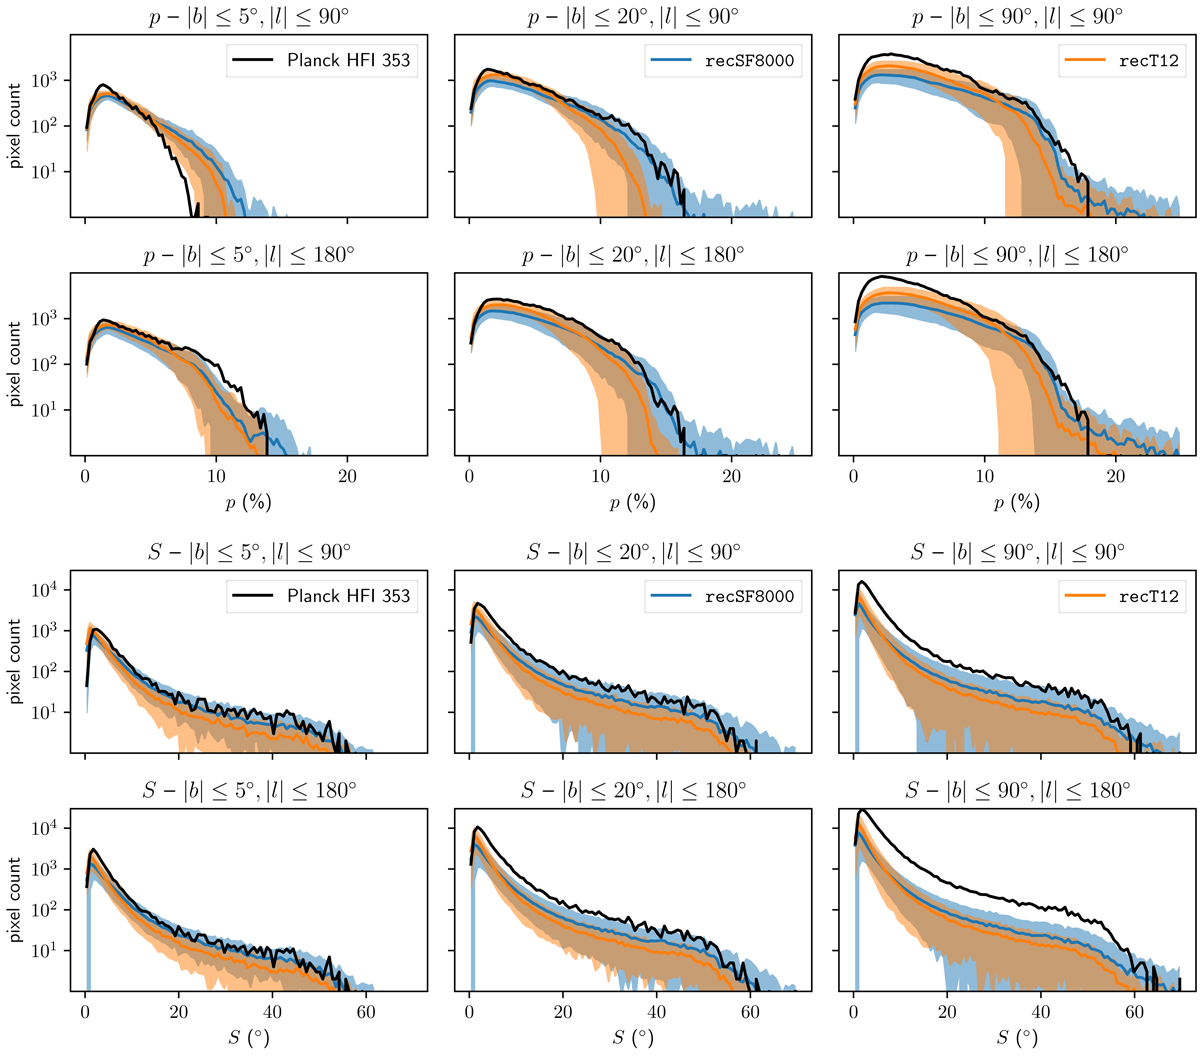
Download original image
Same as Fig. 4, but now showing all models, averaged out over all six level 3 halos and all four observer positions and colour coded by the dust allocation recipe. The solid lines indicate the average in each histogram bin, while the shaded region quantifies the standard deviation in each bin.
Current usage metrics show cumulative count of Article Views (full-text article views including HTML views, PDF and ePub downloads, according to the available data) and Abstracts Views on Vision4Press platform.
Data correspond to usage on the plateform after 2015. The current usage metrics is available 48-96 hours after online publication and is updated daily on week days.
Initial download of the metrics may take a while.