Fig. 4
Download original image
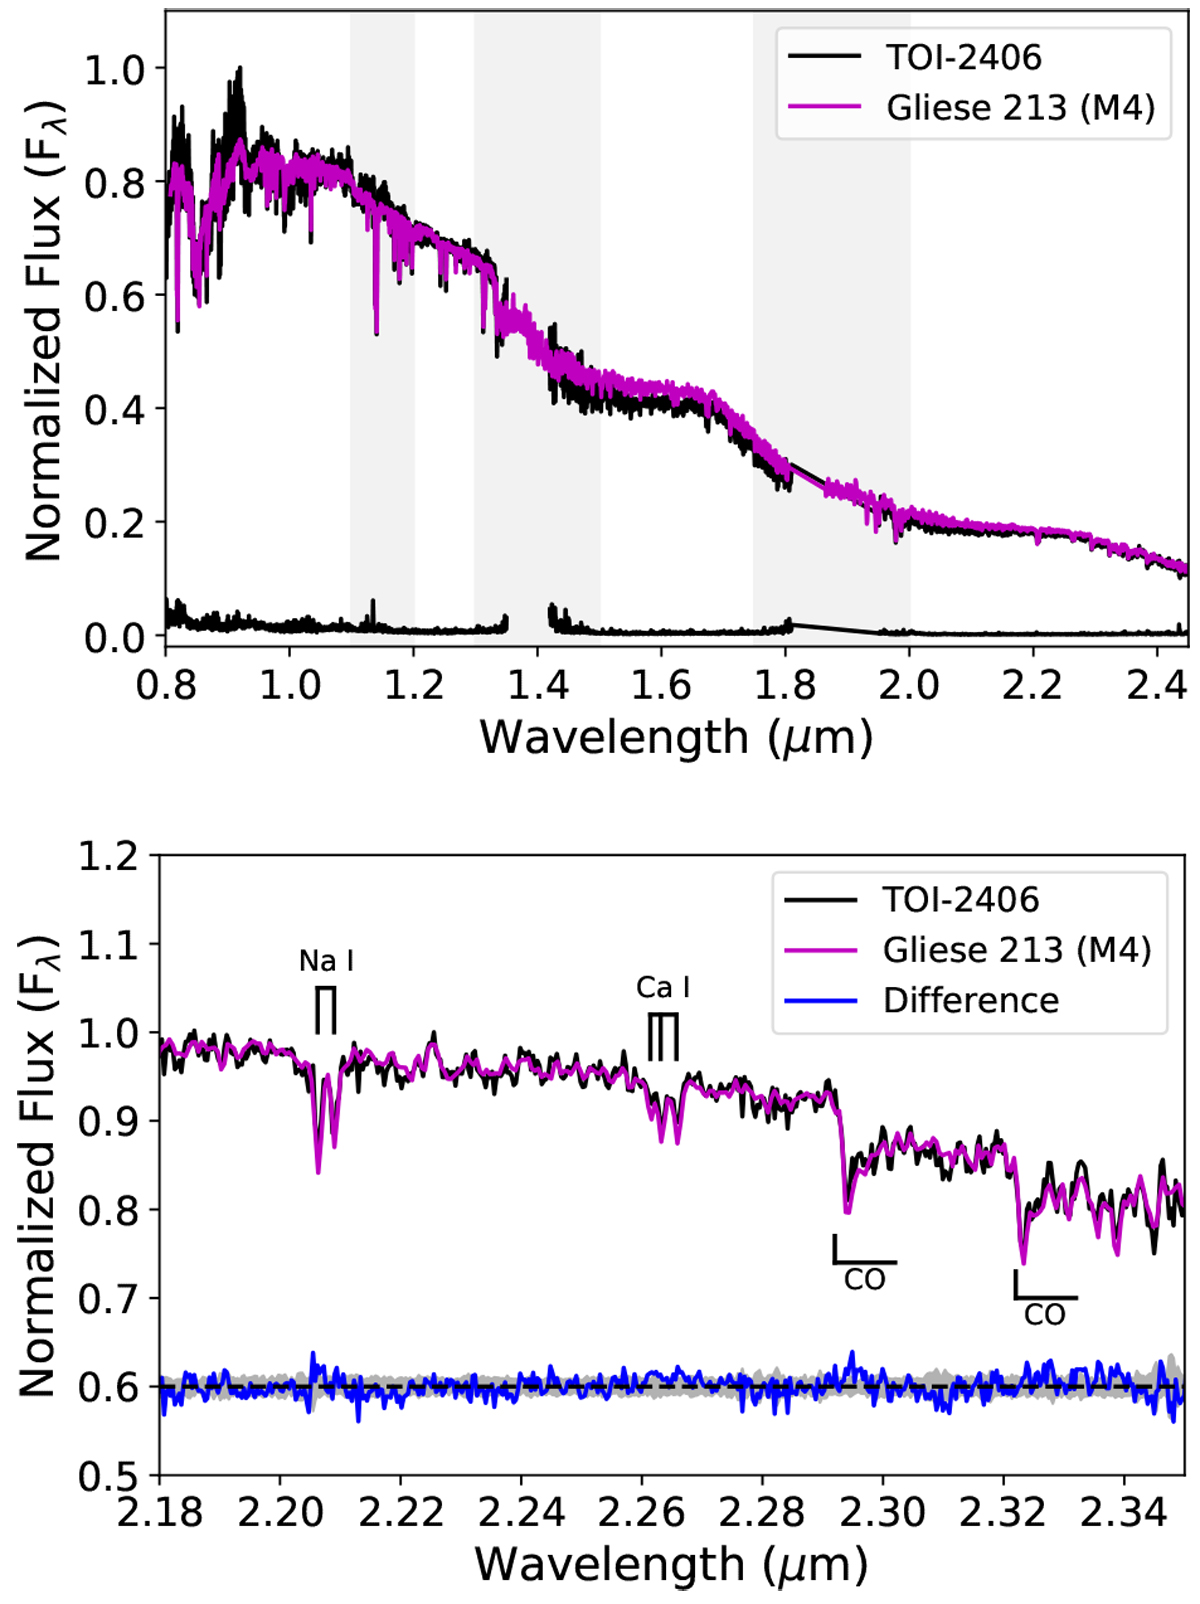
SpeX/SXD near-infrared spectrum of TOI-2406 (black line) compared to equivalent data for the M4.0 spectral standard Gliese 213 (data from Rayner et al. 2009; magenta line). Top: full spectra, with the uncertainty spectrum of TOI-2406 is shown in black along the bottom, and regions of strong telluric absorption are indicated by the grey panels. Bottom: close-up of the K-band region for these two spectra, highlighting the metallicity-sensitive absorption features Na I (λ2.2079 μm) and Ca I (λ2.2640 μm), as well as CO band heads. The difference between the spectra (blue line) is consistent with the measurement uncertainties (grey band).
Current usage metrics show cumulative count of Article Views (full-text article views including HTML views, PDF and ePub downloads, according to the available data) and Abstracts Views on Vision4Press platform.
Data correspond to usage on the plateform after 2015. The current usage metrics is available 48-96 hours after online publication and is updated daily on week days.
Initial download of the metrics may take a while.