Fig. 2
Download original image
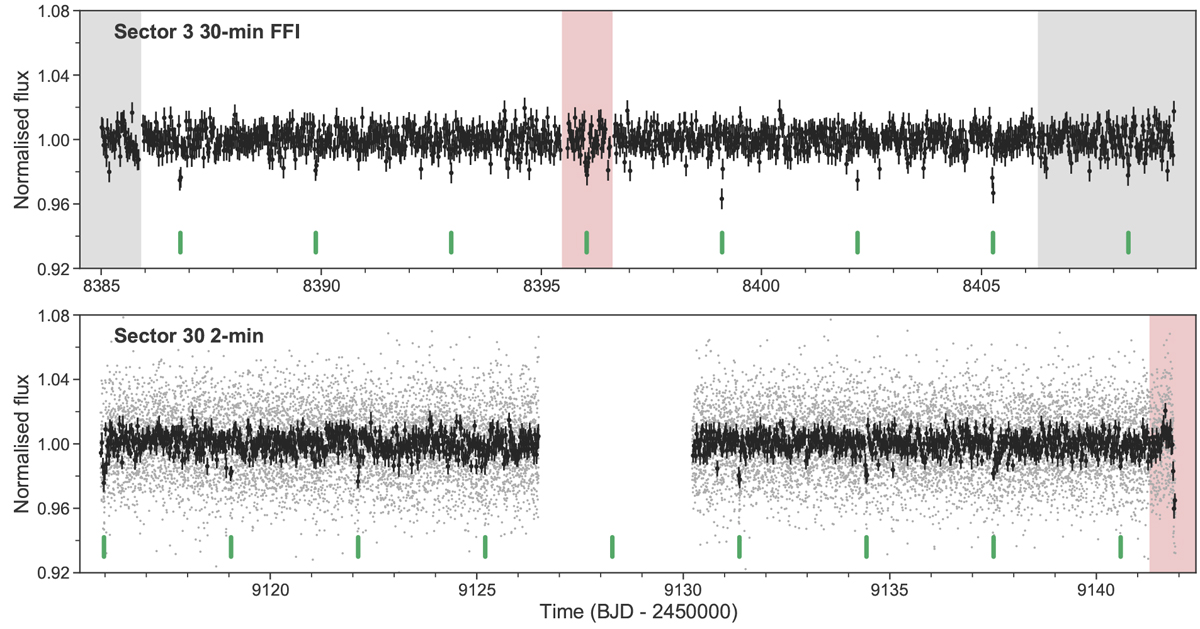
Sector 3 light curve created from FFIs (top) and the Sector 30 2-min light curve (bottom). The 2-min data points (grey) have been binned by 15 to produce the black points, with error bars corresponding to the standard deviation in the bins, which match the FFI light curve cadence of 30 min. Regions marked in red were excluded from the analysis: in Sector 3, there were poor-quality engineering data between orbits; and in Sector 30, a significant trend at the end was possibly caused by scattered light. Regions marked in grey correspond to data taken outside of science data acquisition for testing purposes but used in the analysis. One transit occurred in this period, towards the end of Sector 3. The transits of TOI-2406 b are labelled with green markers below the light curves.
Current usage metrics show cumulative count of Article Views (full-text article views including HTML views, PDF and ePub downloads, according to the available data) and Abstracts Views on Vision4Press platform.
Data correspond to usage on the plateform after 2015. The current usage metrics is available 48-96 hours after online publication and is updated daily on week days.
Initial download of the metrics may take a while.