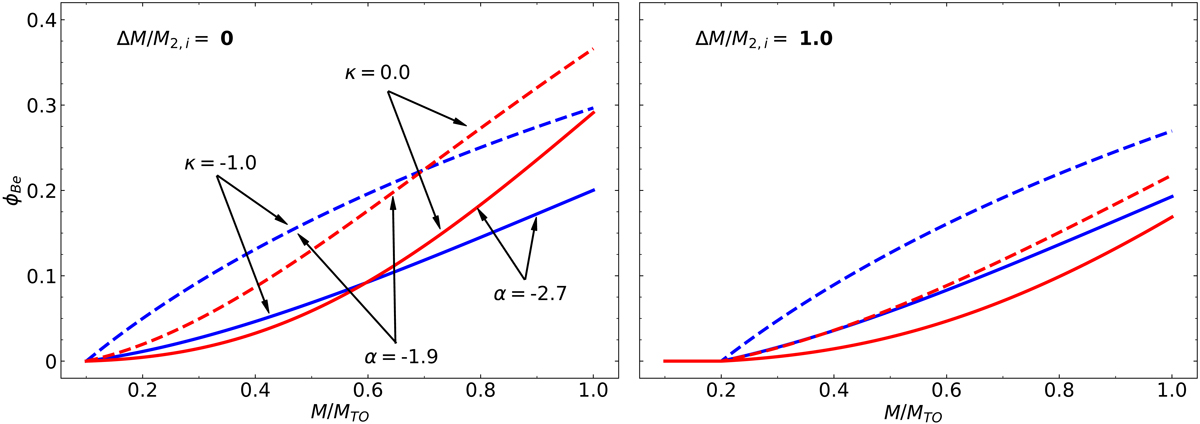
Fig. 1.
Download original image
Maximum Be fraction, ΦBe, in a coeval population as defined by Eq. (30) plotted as a function of fractional main-sequence turn-off mass, M/MTO, for varying parameters. Left and right panels: ΔM/M2, i = 0 and 1, respectively. The colour of the lines represents differing κ values. Red is κ = 0 and blue is κ = −1. Dashed lines show α = −1.9 and solid lines show α = −2.7, as indicated by the annotations.
Current usage metrics show cumulative count of Article Views (full-text article views including HTML views, PDF and ePub downloads, according to the available data) and Abstracts Views on Vision4Press platform.
Data correspond to usage on the plateform after 2015. The current usage metrics is available 48-96 hours after online publication and is updated daily on week days.
Initial download of the metrics may take a while.