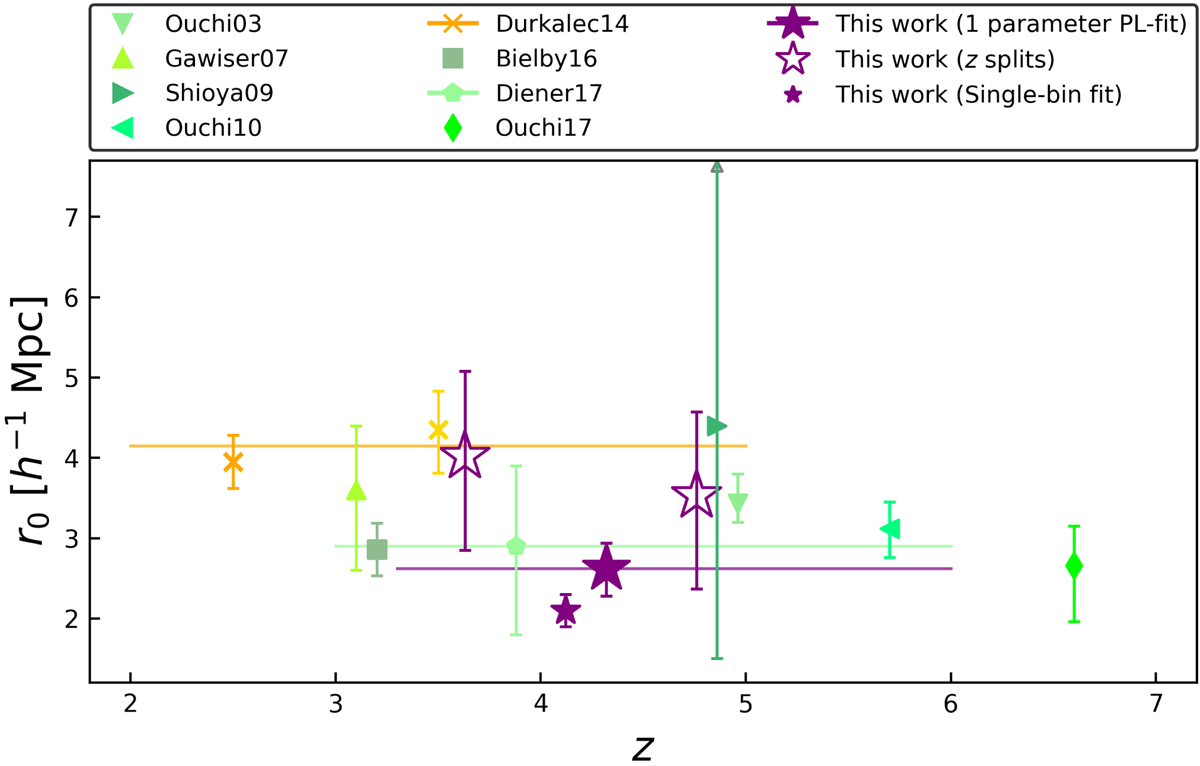
Fig. 9.
Download original image
Comparison of the derived correlation lengths to the literature. The r0 values calculated in this study are represented with purple stars. Green symbols correspond to studies of samples based on Lyα selected galaxies. The samples from Durkalec et al. (2014) at z ∼ 2.5 and z ∼ 3.5 (dark and light yellow) are based on continuum-selected high-z galaxies. The horizontal colored bars indicate the redshift ranges of the corresponding studies (spectroscopic surveys). The redshift range of the z-subsamples of this paper are not plotted for a better visibility. Values for r0 are plotted at the median redshift of the samples. The r0 from Ouchi et al. (2003) and Bielby et al. (2001) have been shifted by +0.1 along the x-axis for visual purposes. Our one-parameter PL-fit with fixed γ = 1.8 by +0.2. The upper limit of the r0 from Shioya et al. (2009) corresponds to r0 = 10.1 Mpc.
Current usage metrics show cumulative count of Article Views (full-text article views including HTML views, PDF and ePub downloads, according to the available data) and Abstracts Views on Vision4Press platform.
Data correspond to usage on the plateform after 2015. The current usage metrics is available 48-96 hours after online publication and is updated daily on week days.
Initial download of the metrics may take a while.