Fig. 8.
Download original image
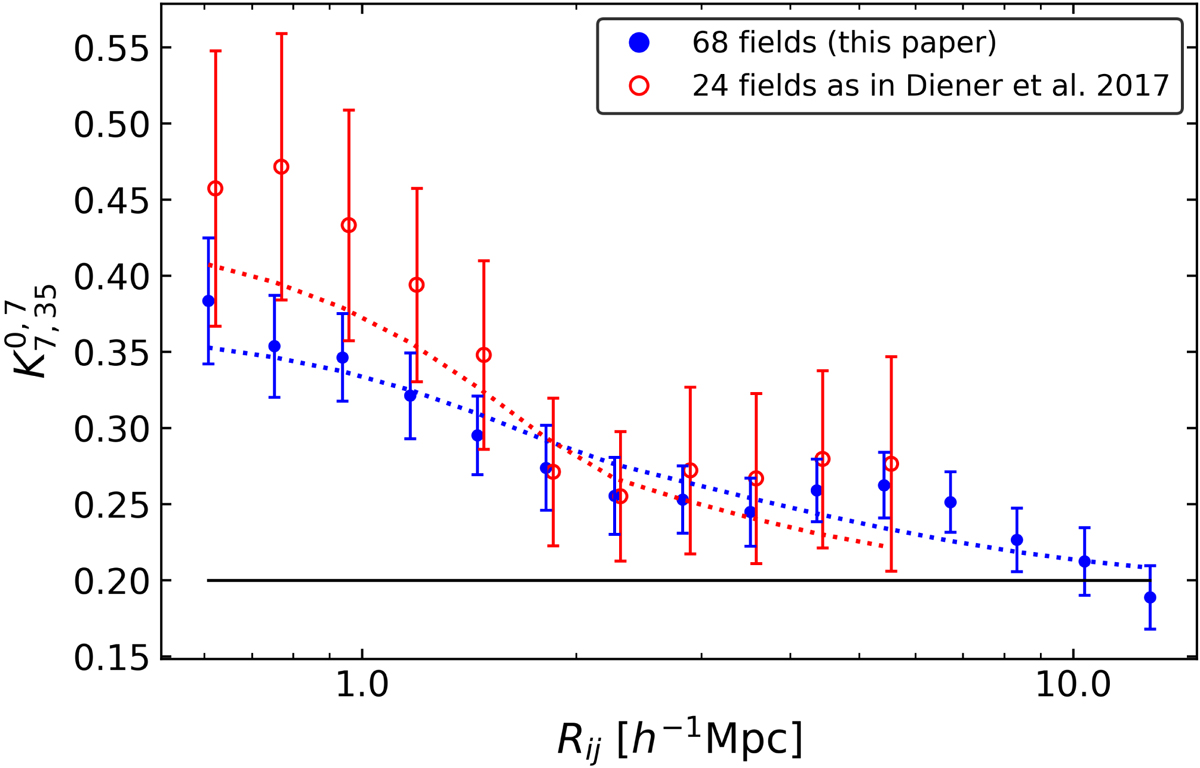
Measured values of the K-estimator of our sample of 68 MUSE-Wide fields (blue filled circles) compared to the subset of 24 fields considered in Diener et al. (2017, D17; open red circles). The error bars are again calculated with the bootstrapping technique described in Sect. 3.1.3. The blue dotted curve represents our two-parameter best PL-fit. The red dotted curve uses the best single-bin fit results of D17 (![]() cMpc for a fixed γ = 1.8) applied to our PL-method (two-parameter PL-fit).
cMpc for a fixed γ = 1.8) applied to our PL-method (two-parameter PL-fit).
Current usage metrics show cumulative count of Article Views (full-text article views including HTML views, PDF and ePub downloads, according to the available data) and Abstracts Views on Vision4Press platform.
Data correspond to usage on the plateform after 2015. The current usage metrics is available 48-96 hours after online publication and is updated daily on week days.
Initial download of the metrics may take a while.