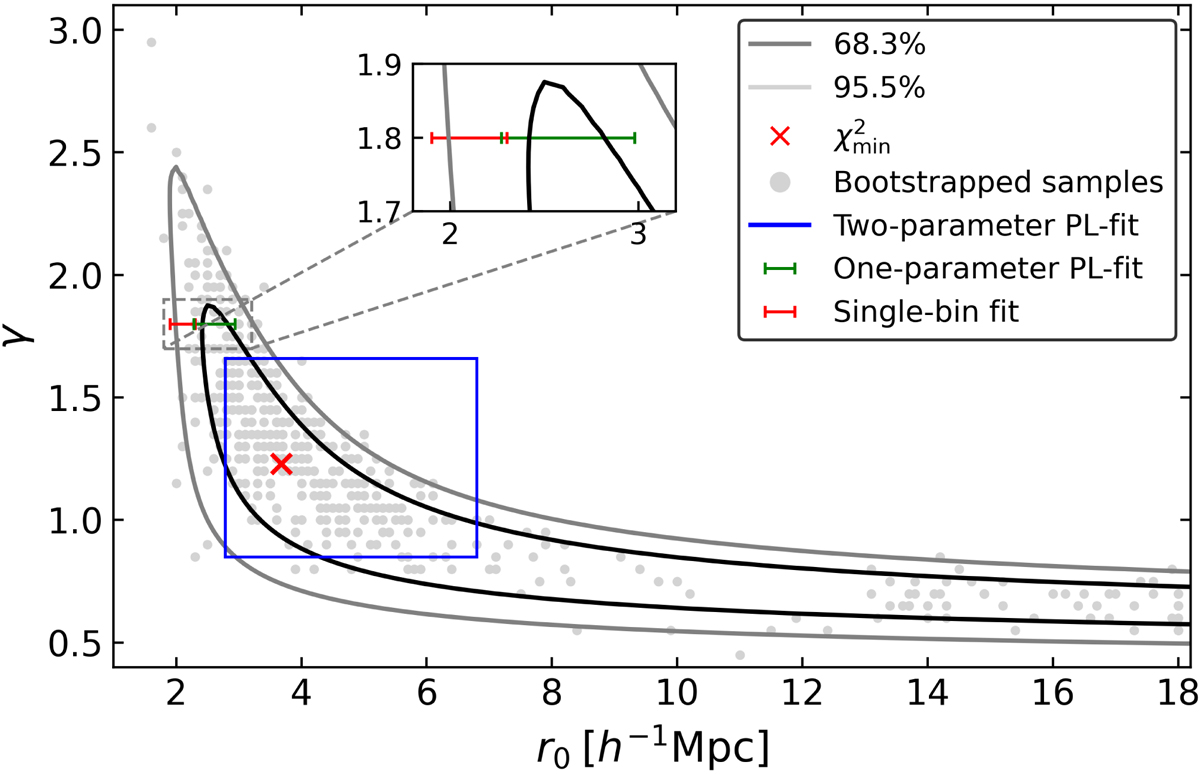
Fig. 6.
Download original image
Simultaneous fit to r0 and slope γ. The black (dark grey) contour represents the 68.3% (95.5%) confidence. The red cross stands for the lowest χ2 value at (r0 = 3.65, γ = 1.25). The points show the 500 best-fit values from the 500 bootstrapped samples. The blue rectangle indicates the 16% and 84% percentiles from the marginalized single-parameter posterior distributions of the bootstrapped samples. The green (red) error bar represents the correlation length from the one-parameter PL (single-bin) fit with fixed γ = 1.8. For a better visualization, we show a zoom onto the region containing these fits.
Current usage metrics show cumulative count of Article Views (full-text article views including HTML views, PDF and ePub downloads, according to the available data) and Abstracts Views on Vision4Press platform.
Data correspond to usage on the plateform after 2015. The current usage metrics is available 48-96 hours after online publication and is updated daily on week days.
Initial download of the metrics may take a while.