Fig. 5.
Download original image
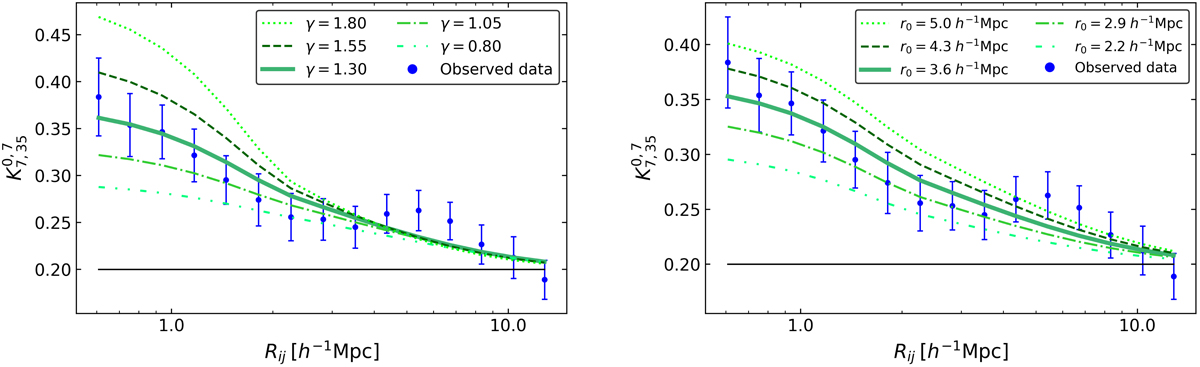
Measured values of the K-estimator as a function of transverse distance (points with error bars) compared to the expected behaviour for a population strictly following a power-law correlation function. Left: five curves represent different power-law indices as given in the legend, for a fixed value of r0 = 3.6 h−1 Mpc. Right: same details for five different correlation lengths at fixed γ = 1.3. The central (thick solid) curves always indicate the minimum χ2 best-fit values. The horizontal straight line shows the no-clustering expectation value of K. The error bars are calculated with the bootstrapping technique described in Sect. 3.1.3.
Current usage metrics show cumulative count of Article Views (full-text article views including HTML views, PDF and ePub downloads, according to the available data) and Abstracts Views on Vision4Press platform.
Data correspond to usage on the plateform after 2015. The current usage metrics is available 48-96 hours after online publication and is updated daily on week days.
Initial download of the metrics may take a while.