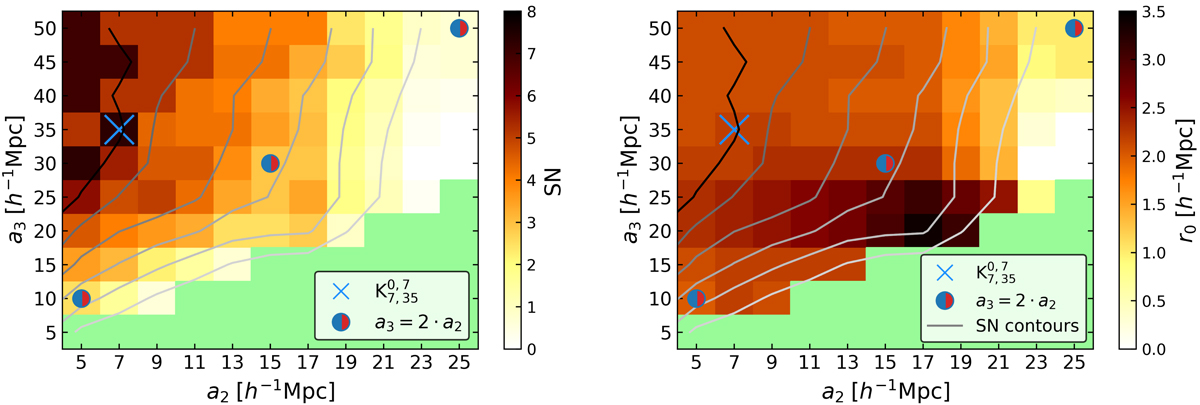
Fig. 4.
Download original image
Results of our grid study to optimize the K-estimator. Left: S/N obtained for each evaluated combination of (a2, a3), displayed as a color map. The green area indicates the ‘forbidden’ range where a3 < a2. The contours trace S/N increments of 2, slightly smoothed for display purposes. Right: same parameters but for the correlation length r0, except that the contours again follow the values of the S/N. The blue-red colored circles represent grid points with a3 = 2a2 for which the blue-red cylinders in Fig. 3 are equally long. The blue cross indicated our adopted parameter combination for the clustering analysis, as it provides the highest S/N and reaches saturation at r0.
Current usage metrics show cumulative count of Article Views (full-text article views including HTML views, PDF and ePub downloads, according to the available data) and Abstracts Views on Vision4Press platform.
Data correspond to usage on the plateform after 2015. The current usage metrics is available 48-96 hours after online publication and is updated daily on week days.
Initial download of the metrics may take a while.