Free Access
Fig. E.1.
Download original image
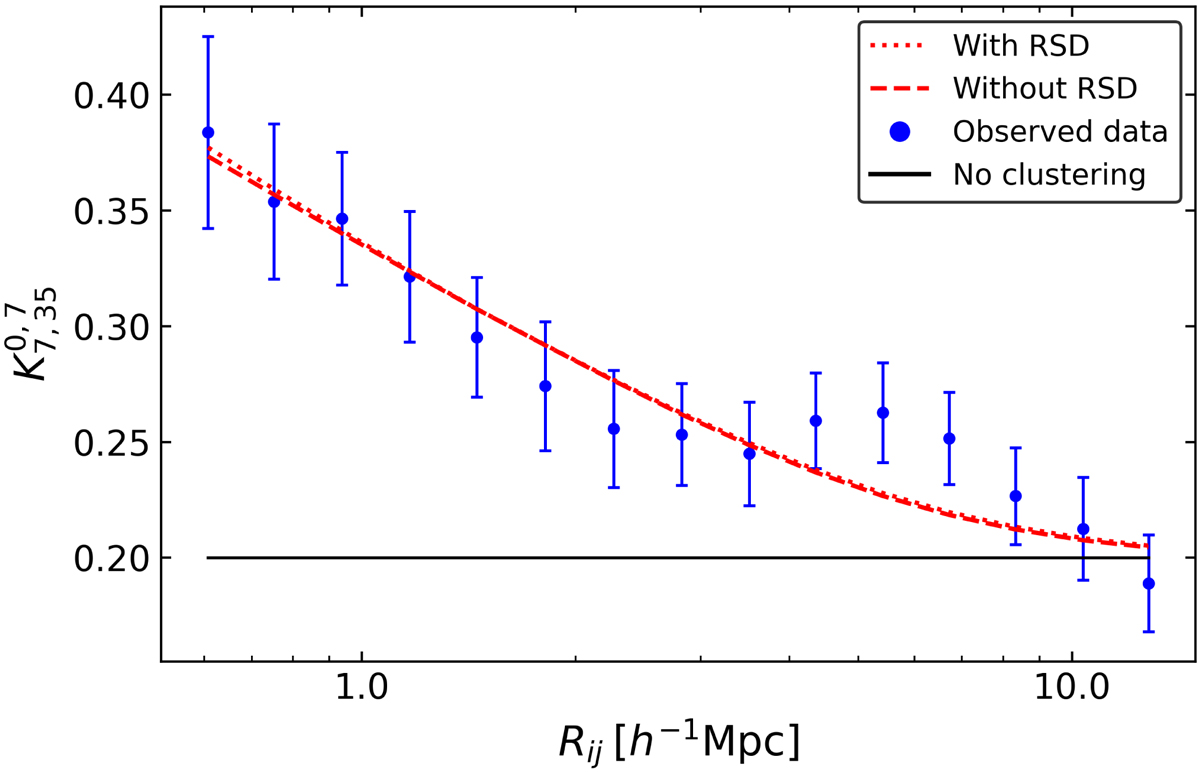
Best HOD fits to the K-estimator from ξ(r) (same as the thick curve in Fig. 7) and ξ(s). The dotted red curve represents the HOD that takes into account the effect of the RSD, while the dashed red curve shows the HOD fit without RSD. The black line represents an unclustered sample of galaxies.
Current usage metrics show cumulative count of Article Views (full-text article views including HTML views, PDF and ePub downloads, according to the available data) and Abstracts Views on Vision4Press platform.
Data correspond to usage on the plateform after 2015. The current usage metrics is available 48-96 hours after online publication and is updated daily on week days.
Initial download of the metrics may take a while.