Fig. D.2.
Download original image
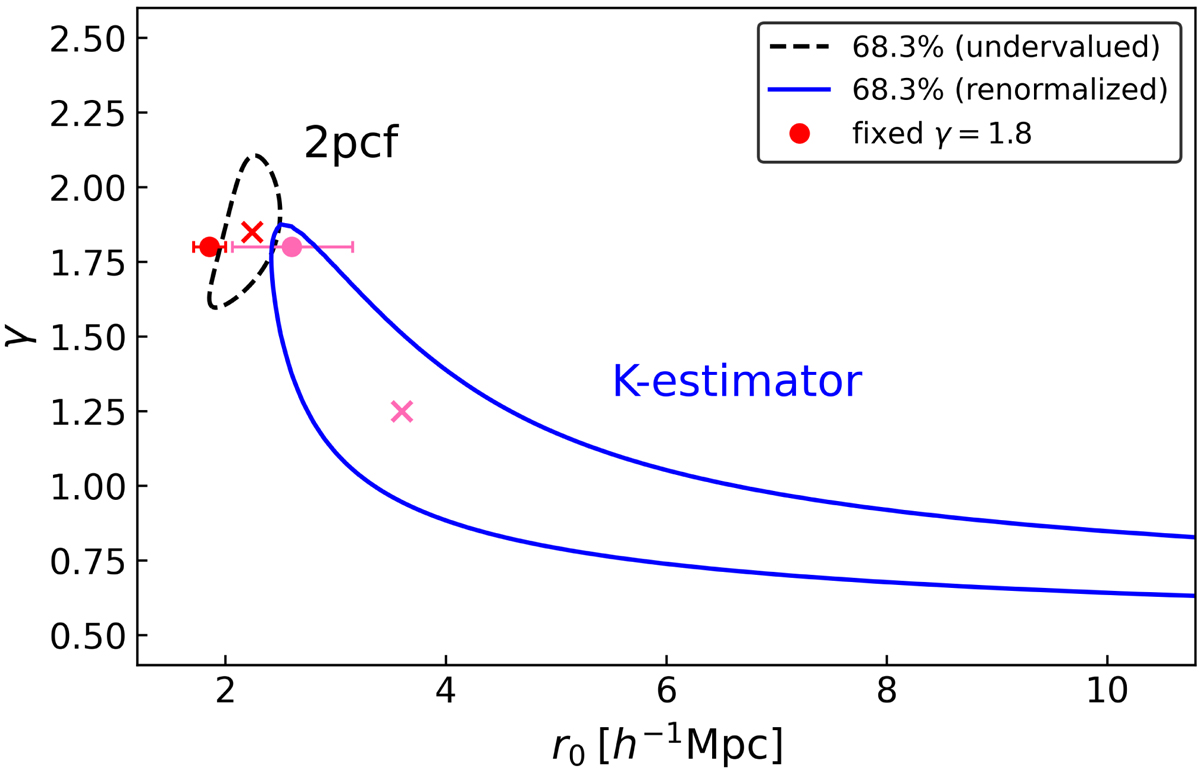
Analogous to Fig. 6, here showing the contours from the 2pcf method in black-gray. For a direct comparison to the K-estimator, its contours have been represented in blue, as well as the r0 computed from both methods when fixing the slope of the PL to the standard value, shown with dots. Please note that we consider the contours of the 2pcf to be likely underestimated (see text for further details).
Current usage metrics show cumulative count of Article Views (full-text article views including HTML views, PDF and ePub downloads, according to the available data) and Abstracts Views on Vision4Press platform.
Data correspond to usage on the plateform after 2015. The current usage metrics is available 48-96 hours after online publication and is updated daily on week days.
Initial download of the metrics may take a while.