Free Access
Fig. D.1.
Download original image
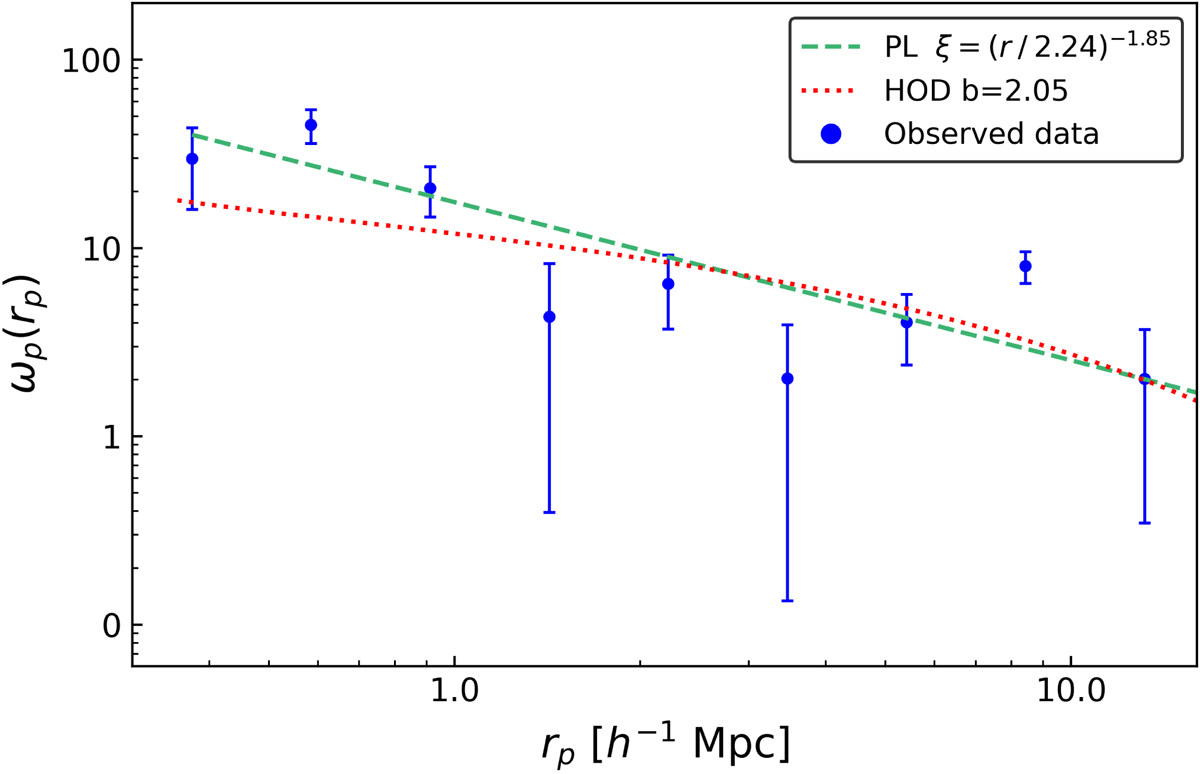
Best PL and HOD fits to the projected 2pcf ωp(rp) for πmax = 60 h−1 Mpc. The dashed green curve shows the PL-fit while the dotted red curve represents the HOD fit. The error bars are determined from the random approach explained in Appendix D.2.
Current usage metrics show cumulative count of Article Views (full-text article views including HTML views, PDF and ePub downloads, according to the available data) and Abstracts Views on Vision4Press platform.
Data correspond to usage on the plateform after 2015. The current usage metrics is available 48-96 hours after online publication and is updated daily on week days.
Initial download of the metrics may take a while.