Fig. B.1.
Download original image
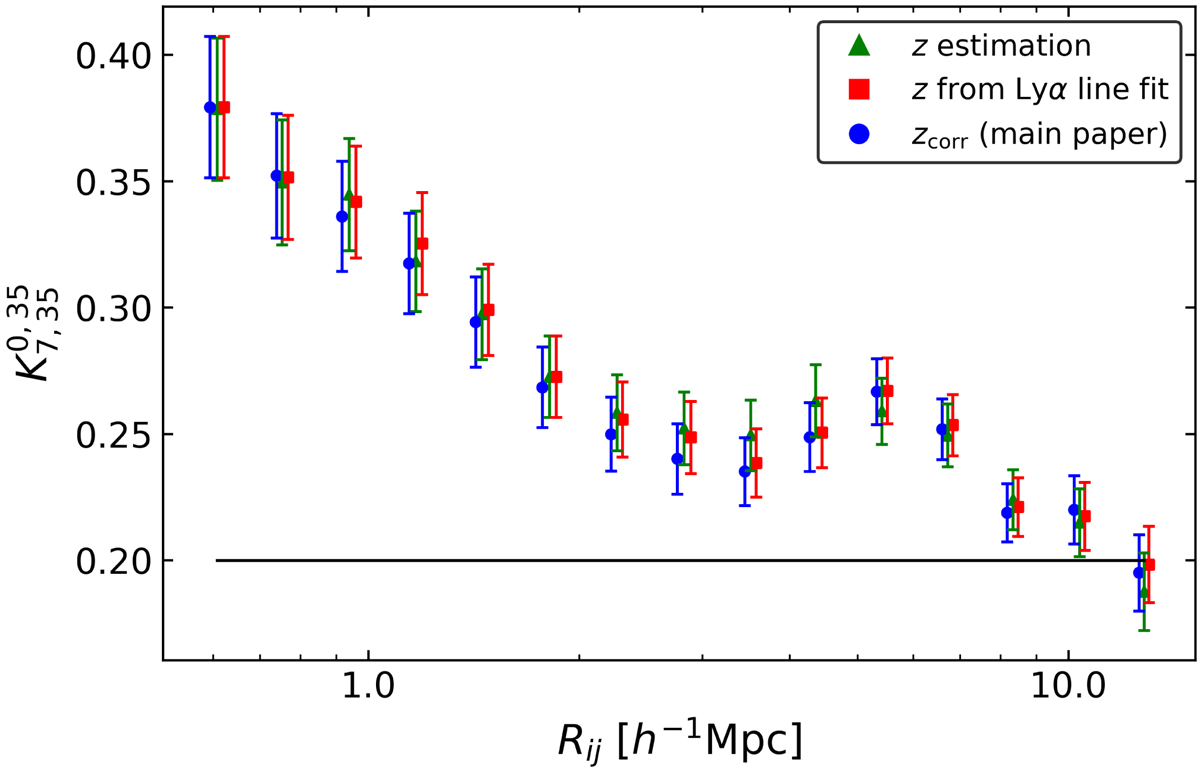
![]() estimator for the LAEs in the MUSE-Wide survey. The green triangles represent the K-estimator values of the sample of LAEs with redshift estimations from QtClassify, the red squares show the K values when the redshifts are obtained from the Lyα line fit with asymmetric Gaussians and the blue circles show the same previous redshifts but including the correction for the offset between the Lyα and the systemic redshift (same as in all plots in the main paper where the K-estimator results are shown). The black straight line shows the expected K value of an unclustered sample. All sets of data points are plotted along with Poisson errors. The blue circle and red square values have been shifted along the x-axis for visual purposes.
estimator for the LAEs in the MUSE-Wide survey. The green triangles represent the K-estimator values of the sample of LAEs with redshift estimations from QtClassify, the red squares show the K values when the redshifts are obtained from the Lyα line fit with asymmetric Gaussians and the blue circles show the same previous redshifts but including the correction for the offset between the Lyα and the systemic redshift (same as in all plots in the main paper where the K-estimator results are shown). The black straight line shows the expected K value of an unclustered sample. All sets of data points are plotted along with Poisson errors. The blue circle and red square values have been shifted along the x-axis for visual purposes.
Current usage metrics show cumulative count of Article Views (full-text article views including HTML views, PDF and ePub downloads, according to the available data) and Abstracts Views on Vision4Press platform.
Data correspond to usage on the plateform after 2015. The current usage metrics is available 48-96 hours after online publication and is updated daily on week days.
Initial download of the metrics may take a while.