Free Access
Fig. A.1.
Download original image
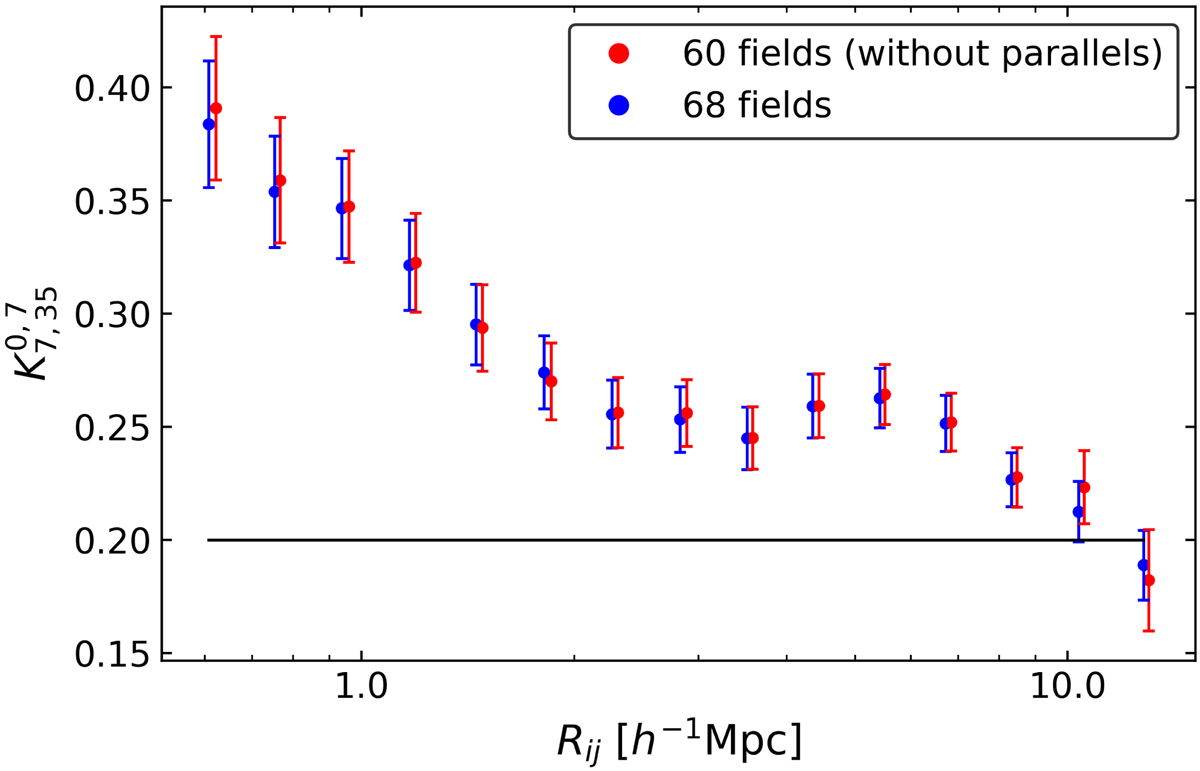
![]() estimator for the LAEs in 60 and 68 fields of the MUSE-Wide survey in red and blue, respectively. The black straight line shows the expected K value of an unclustered sample. All error bars are Poissonian. The red dots have been shifted along the x-axis for visual purposes.
estimator for the LAEs in 60 and 68 fields of the MUSE-Wide survey in red and blue, respectively. The black straight line shows the expected K value of an unclustered sample. All error bars are Poissonian. The red dots have been shifted along the x-axis for visual purposes.
Current usage metrics show cumulative count of Article Views (full-text article views including HTML views, PDF and ePub downloads, according to the available data) and Abstracts Views on Vision4Press platform.
Data correspond to usage on the plateform after 2015. The current usage metrics is available 48-96 hours after online publication and is updated daily on week days.
Initial download of the metrics may take a while.