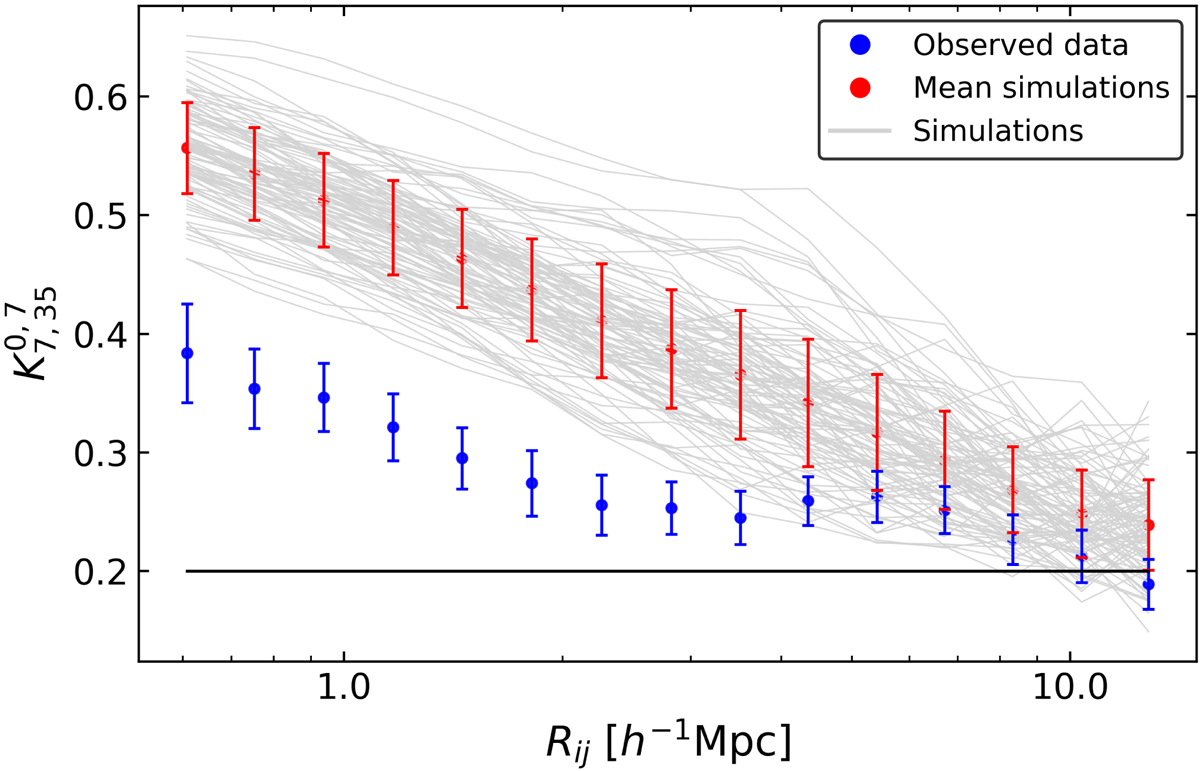
Fig. 13.
Download original image
Comparison between the clustering signal in our real survey in blue (same as in Fig. 5) and in the 100 simulated samples. Each sample is drawn from a different light-cone realization. The values of the K-estimator for each of the 100 simulated catalogues is represented in gray. The standard deviation of the 100 K-estimator values and their average values are shown in red.
Current usage metrics show cumulative count of Article Views (full-text article views including HTML views, PDF and ePub downloads, according to the available data) and Abstracts Views on Vision4Press platform.
Data correspond to usage on the plateform after 2015. The current usage metrics is available 48-96 hours after online publication and is updated daily on week days.
Initial download of the metrics may take a while.