Fig. 12.
Download original image
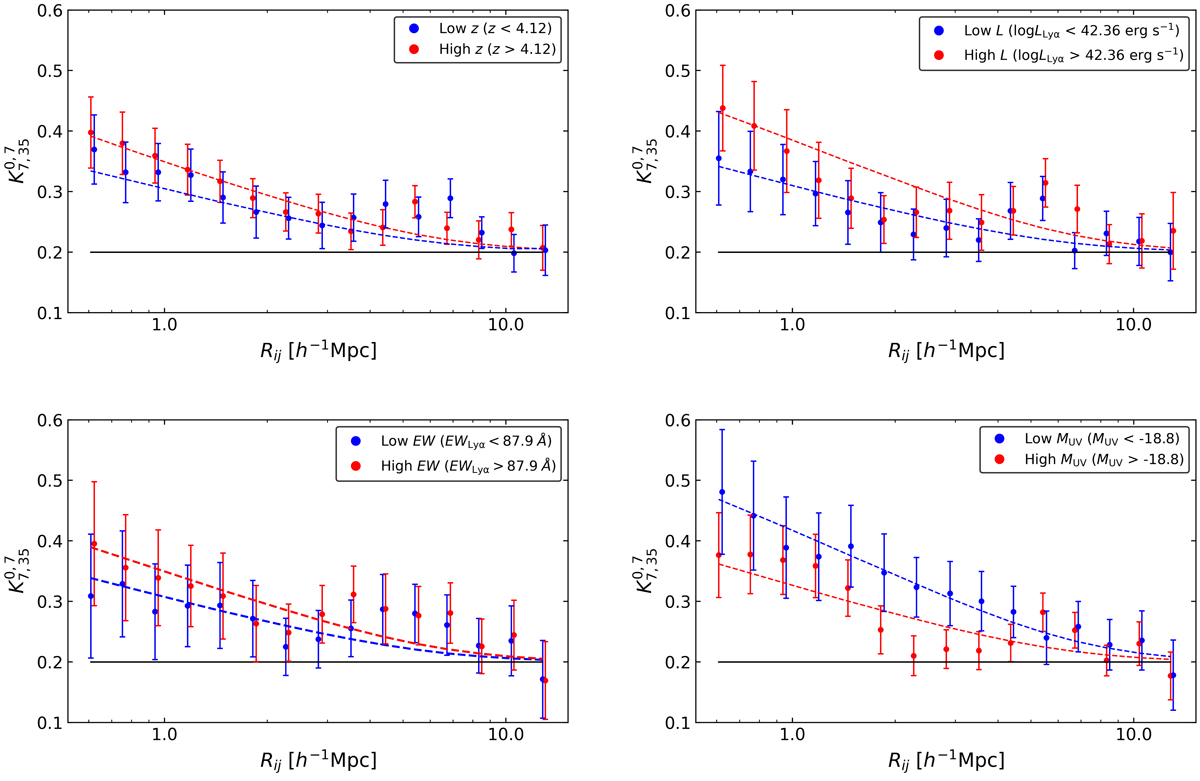
Clustering dependencies on object properties. Top left: clustering variation in two different redshift subsamples. The blue dots show the clustering in the lower redshift bin while the red points show the higher redshift subsample. The dotted curves represent the best HOD fits. Top right: same details but for two different Lyα luminosity subsamples. Bottom left: same details but for EWLyα. Bottom right: same details but for UV absolute magnitude. The black line represents the K expectation value for an unclustered sample of galaxies and the 1σ error bars are determined from the bootstrapping approach explained in Sect. 3.1.3.
Current usage metrics show cumulative count of Article Views (full-text article views including HTML views, PDF and ePub downloads, according to the available data) and Abstracts Views on Vision4Press platform.
Data correspond to usage on the plateform after 2015. The current usage metrics is available 48-96 hours after online publication and is updated daily on week days.
Initial download of the metrics may take a while.