Free Access
Fig. 7.
Download original image
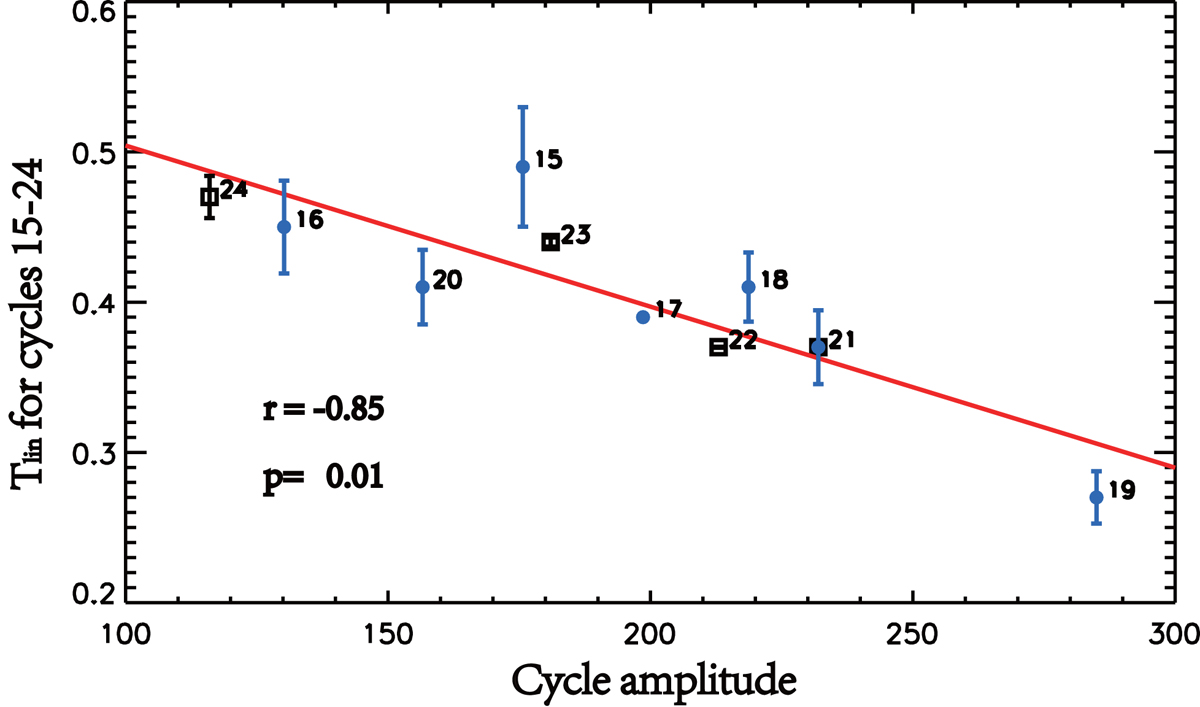
Tilt coefficients based on the combined data versus the strength of cycles 15 to 24. The blue dots represent coefficients based on MW with ![]() . The black squares represent coefficients based on DPDall with
. The black squares represent coefficients based on DPDall with ![]() . The red solid line is the fitting result of the data. The error bars represent one standard error.
. The red solid line is the fitting result of the data. The error bars represent one standard error.
Current usage metrics show cumulative count of Article Views (full-text article views including HTML views, PDF and ePub downloads, according to the available data) and Abstracts Views on Vision4Press platform.
Data correspond to usage on the plateform after 2015. The current usage metrics is available 48-96 hours after online publication and is updated daily on week days.
Initial download of the metrics may take a while.