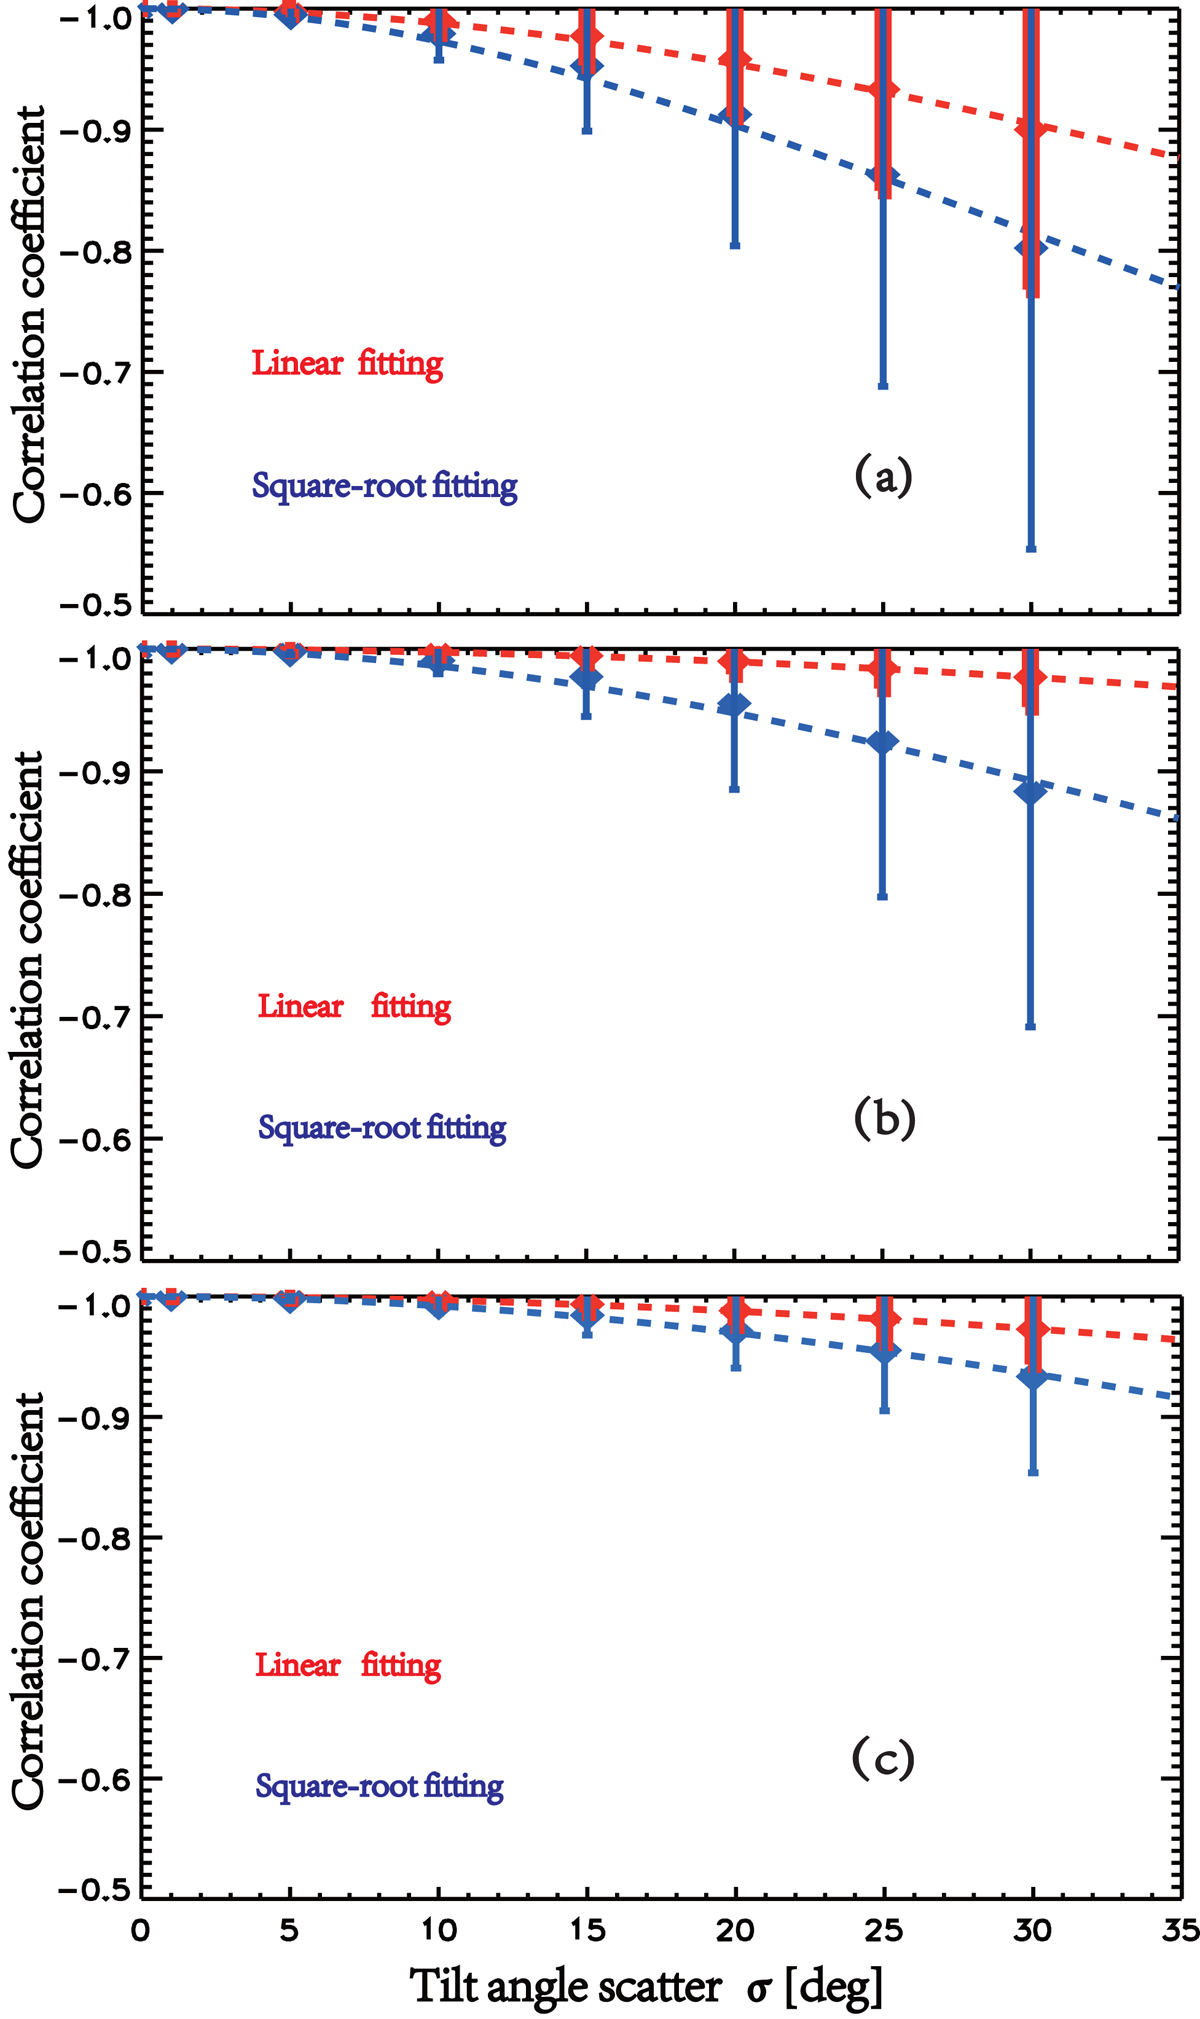
Fig. 6.
Download original image
Variations of the CCs with σα based on the Monte Carlo simulations. Panel a: results of the normalization method. Panel b: results of the binned fitting method. Panel c: results of the unbinned fitting method. The blue and red dotted curves depict the best-fit of the tilt angle scatter and correlation coefficients for the linear form and the square-root form of Joy’s law, respectively. Error bars represent one standard error for 10 000 correlation coefficients sets in each tilt angle scatters.
Current usage metrics show cumulative count of Article Views (full-text article views including HTML views, PDF and ePub downloads, according to the available data) and Abstracts Views on Vision4Press platform.
Data correspond to usage on the plateform after 2015. The current usage metrics is available 48-96 hours after online publication and is updated daily on week days.
Initial download of the metrics may take a while.